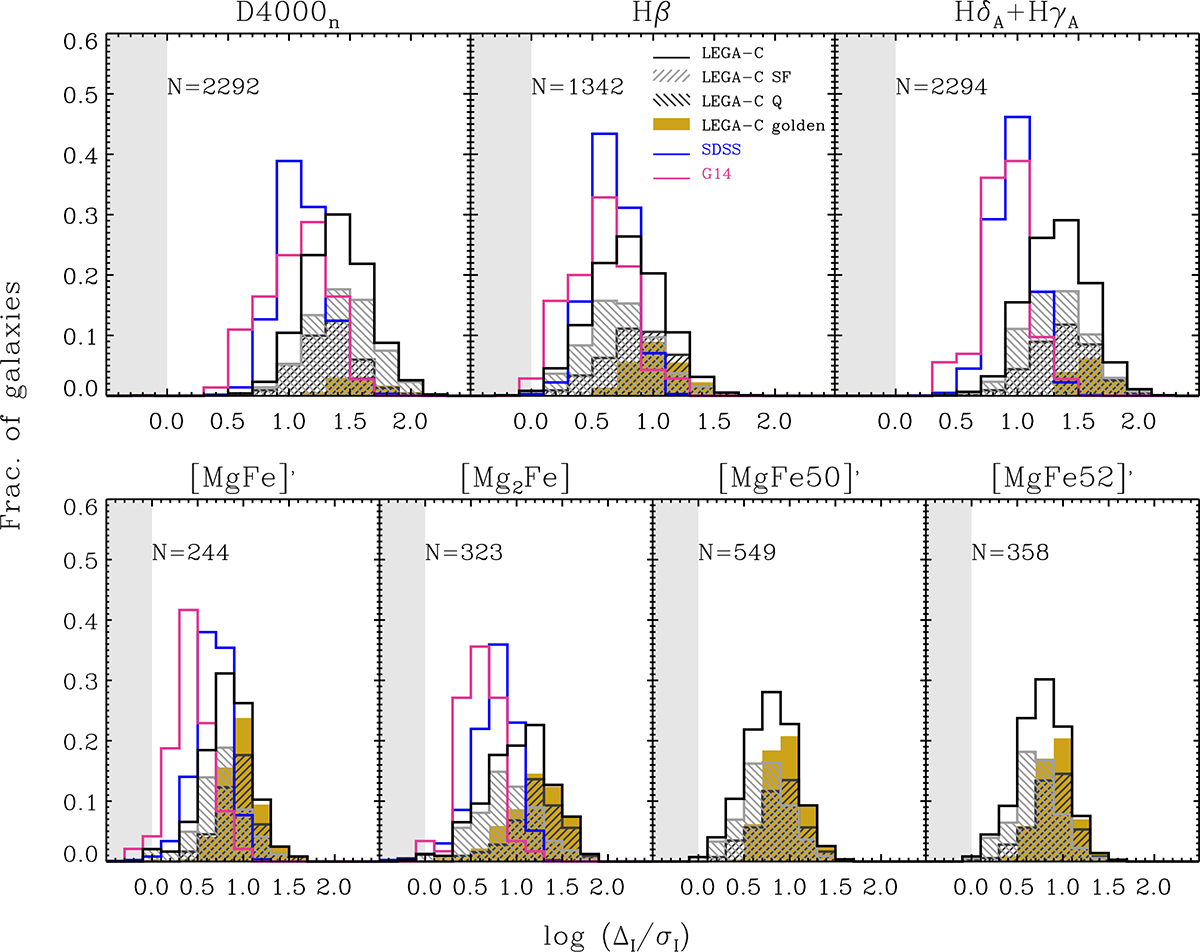
Fig. A.1.
Download original image
Resolving power of the absorption indices used in this work. The resolving power is defined as the index dynamic range of the observed sample divided by the observational error on each index measure. The solid black histograms include all the galaxies with a valid measurement of the given absorption index among the 2588 unique galaxies in the LEGA-C primary sample with a measurement of stellar velocity dispersion. Each histogram is normalised by the total number of galaxies used, N, which is reported in each panel. The dark and light grey hatched histograms refer to the Q and SF LEGA-C galaxies, respectively. The golden histograms refer to the golden sub-sample used in this work. All these histograms are normalised by N. The distributions for LEGA-C galaxies are compared, when available, to those of SDSS DR7 (blue) and of G14 (magenta) samples, each normalised by their total number of galaxies.
Current usage metrics show cumulative count of Article Views (full-text article views including HTML views, PDF and ePub downloads, according to the available data) and Abstracts Views on Vision4Press platform.
Data correspond to usage on the plateform after 2015. The current usage metrics is available 48-96 hours after online publication and is updated daily on week days.
Initial download of the metrics may take a while.