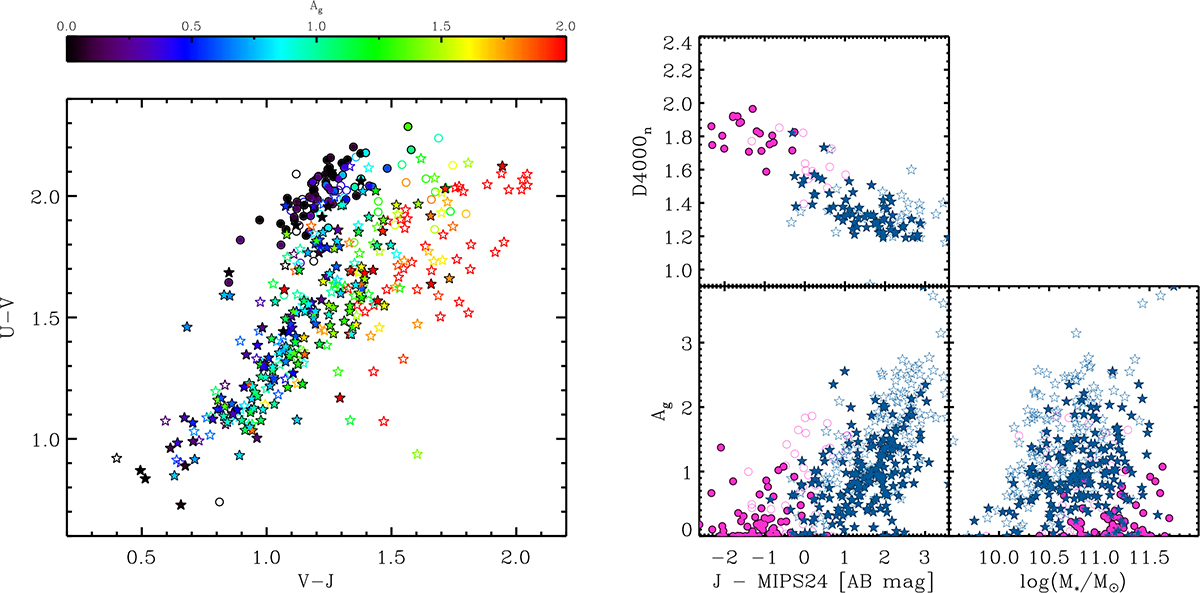
Fig. C.1.
Download original image
Comparison between estimated dust attenuation and expectations based on spectro-photometric diagnostics. Left-hand figure: Distribution in rest-frame U-V, V-J colour for our sample galaxies. Filled (empty) symbols refer to the golden (silver) sample, while circles and stars distinguish Q and SF galaxies. The colour-coding indicates the dust attenuation Ag estimated from BaStA fitting of spectral indices and rizYJ photometry. Right-hand figure: distribution in 4000Å-break versus J − 24 μm colour (upper panel) and in estimated dust attenuation Ag versus J − 24 μm colour (lower-left panel) or versus stellar mass (lower-right panel).
Current usage metrics show cumulative count of Article Views (full-text article views including HTML views, PDF and ePub downloads, according to the available data) and Abstracts Views on Vision4Press platform.
Data correspond to usage on the plateform after 2015. The current usage metrics is available 48-96 hours after online publication and is updated daily on week days.
Initial download of the metrics may take a while.