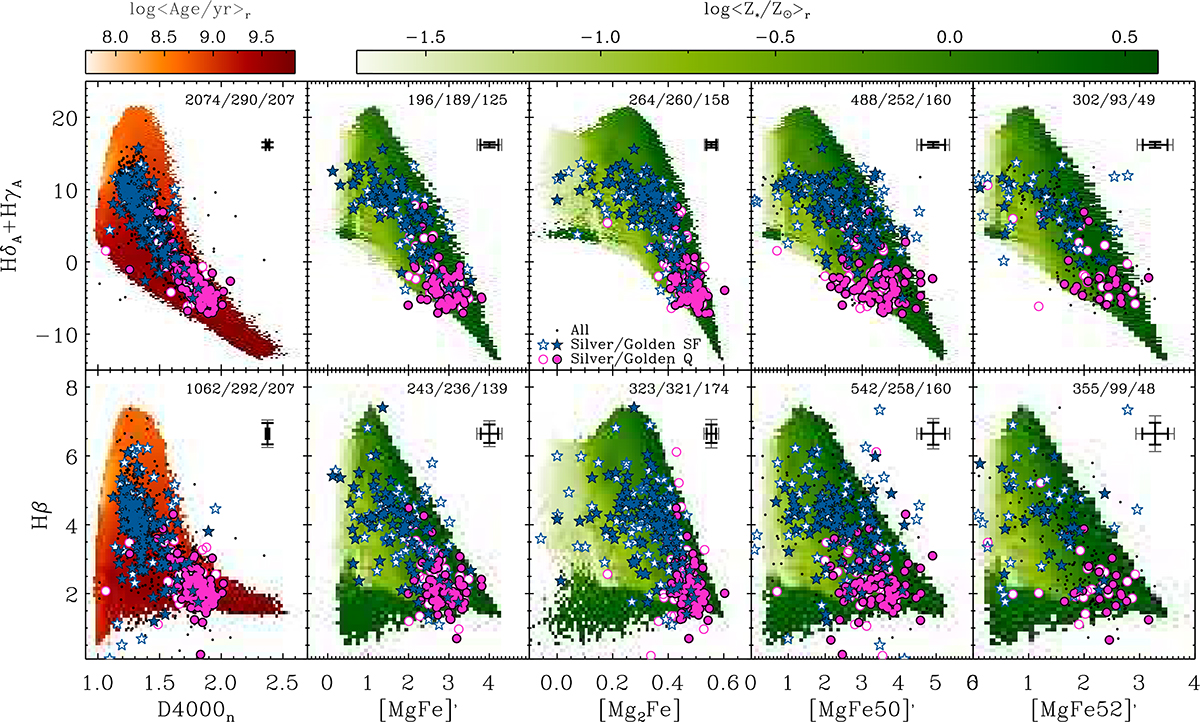
Fig. 3.
Download original image
Distribution in diagnostic diagrams of the absorption indices showing the combinations of indices considered in this work for their different sensitivity to age and metallicity. The coloured region shows the distribution of the adopted model library of complex star formation and metal enrichment histories (see Sect. 3.1), colour-coded for r-band light-weighted age (left-most panels) and for r-band light-weighted stellar metallicity. Symbols are as in Fig. 2: galaxies are distinguished into quiescent (magenta) and star-forming (blue) based on a mass-dependent threshold in specific SFR; empty symbols indicate galaxies belonging to the silver sample, i.e. with optimal combinations of indices, while filled symbols refer to the golden sub-sample (with S/N > 20); dots display all the galaxies in the LEGA-C sample with measurements of the two indices in each panel. In each panel only galaxies for which the corresponding couple of indices has been used in the fit are shown (therefore all the galaxies shown lie within 3σ of the model region). In each panel we report the number of galaxies shown among those in the full LEGA-C, silver or golden samples. The error bars display the median uncertainty on each index for the golden (thick black) and the silver galaxies (thin grey).
Current usage metrics show cumulative count of Article Views (full-text article views including HTML views, PDF and ePub downloads, according to the available data) and Abstracts Views on Vision4Press platform.
Data correspond to usage on the plateform after 2015. The current usage metrics is available 48-96 hours after online publication and is updated daily on week days.
Initial download of the metrics may take a while.