Fig. 4.
Download original image
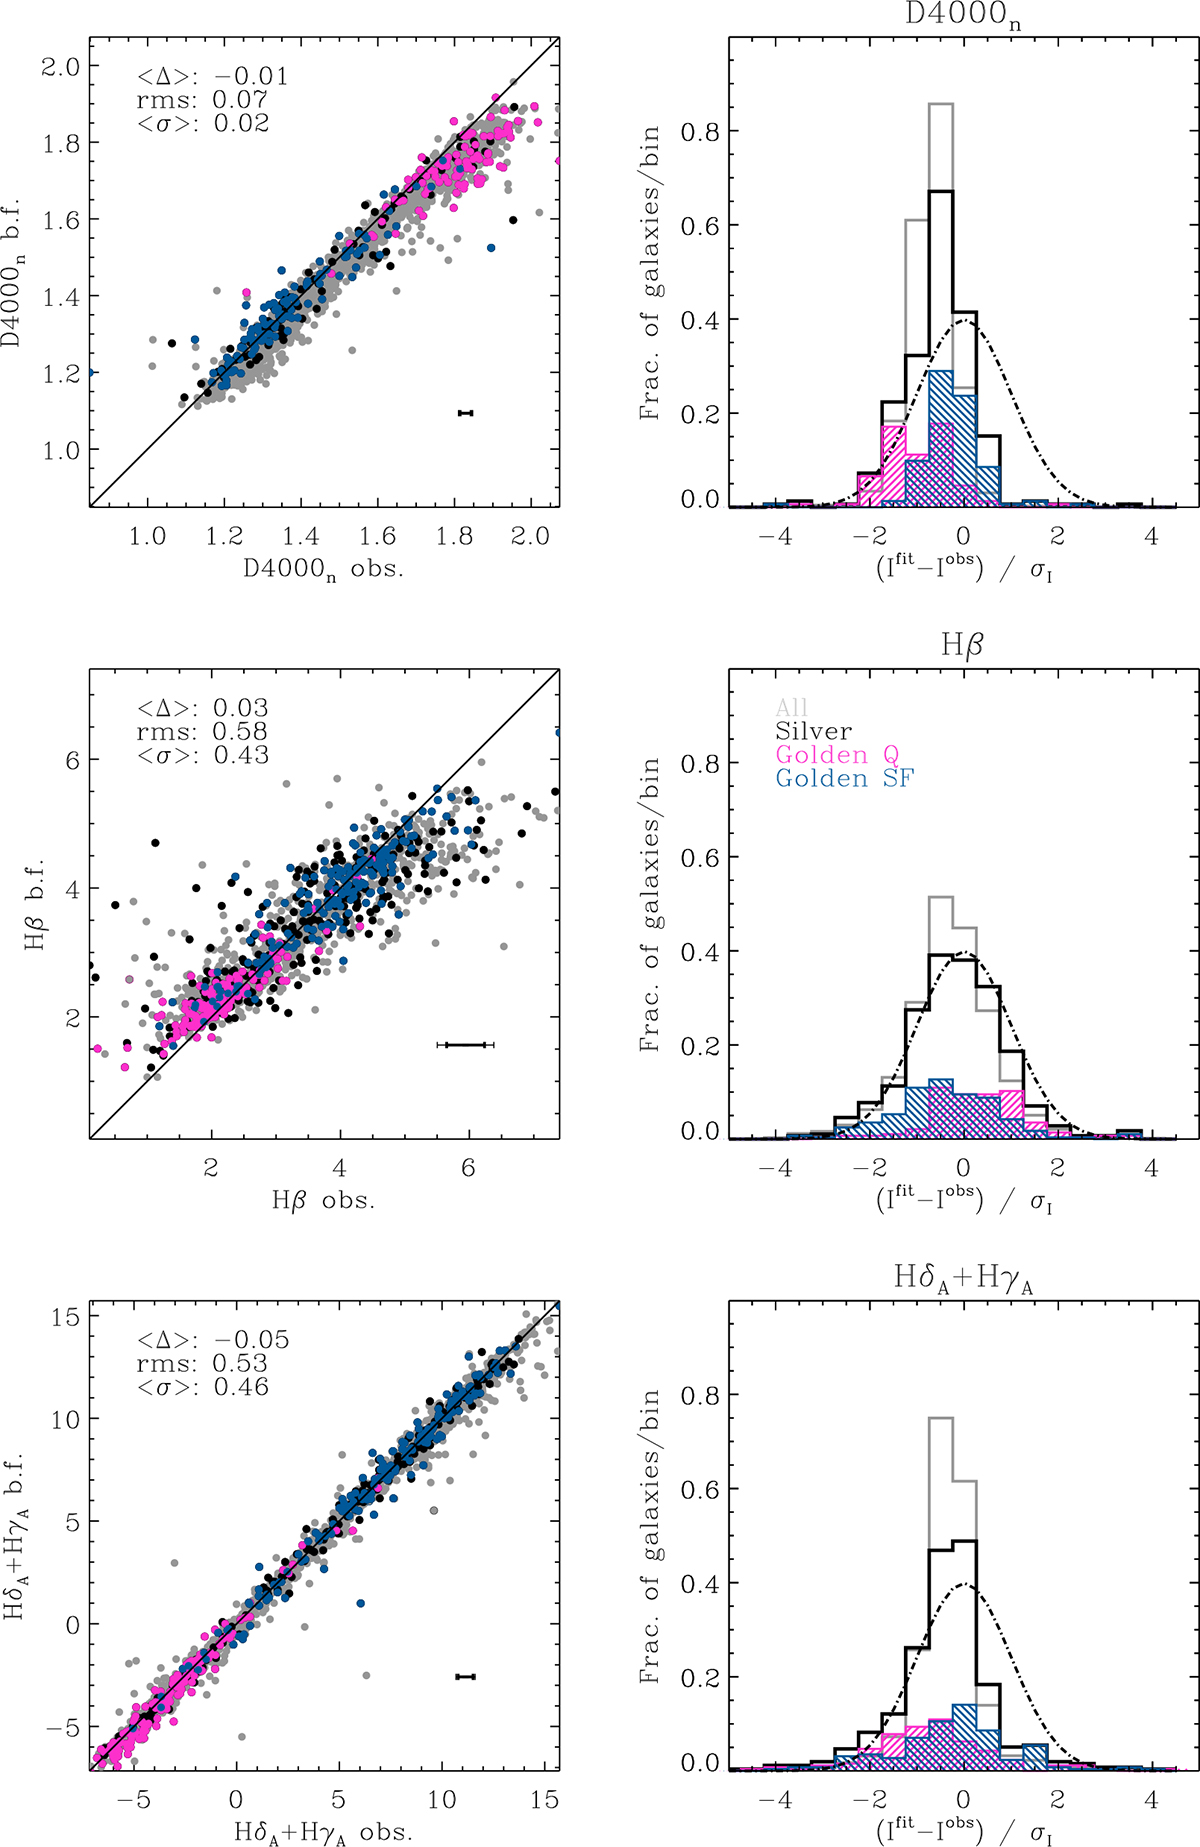
Comparison between observed and best-fit predicted index strengths for the absorption features considered in the BaStA fit as age-sensitive diagnostics. Left panels: Best-fit versus observed index strength. Grey filled circles show the full primary LEGA-C catalogue for which the index is measured; black circles highlight galaxies in the silver sample; magenta (blue) circles highlight quiescent (star-forming) galaxies in the golden sample. Filled symbols indicate galaxies for which the index has been used in the fit. The thin and thick error bars indicate the median observational error for silver and golden galaxies respectively. The median offset, rms scatter and the median uncertainty are reported in each panel for the silver sample. Right panels: distribution of the difference between the absorption index strength predicted by the best-fit model and the observed one, normalised by the observational error (regardless of whether the index was used in the fit). Grey histograms are for the whole LEGA-C sample (normalised to unit area); black, magenta, blue histograms refer to the silver, golden Q, golden SF respectively (normalised to the silver sample). A Gaussian centred on zero and with unit standard deviation is shown for reference (dot-dashed curve).
Current usage metrics show cumulative count of Article Views (full-text article views including HTML views, PDF and ePub downloads, according to the available data) and Abstracts Views on Vision4Press platform.
Data correspond to usage on the plateform after 2015. The current usage metrics is available 48-96 hours after online publication and is updated daily on week days.
Initial download of the metrics may take a while.