Fig. 6.
Download original image
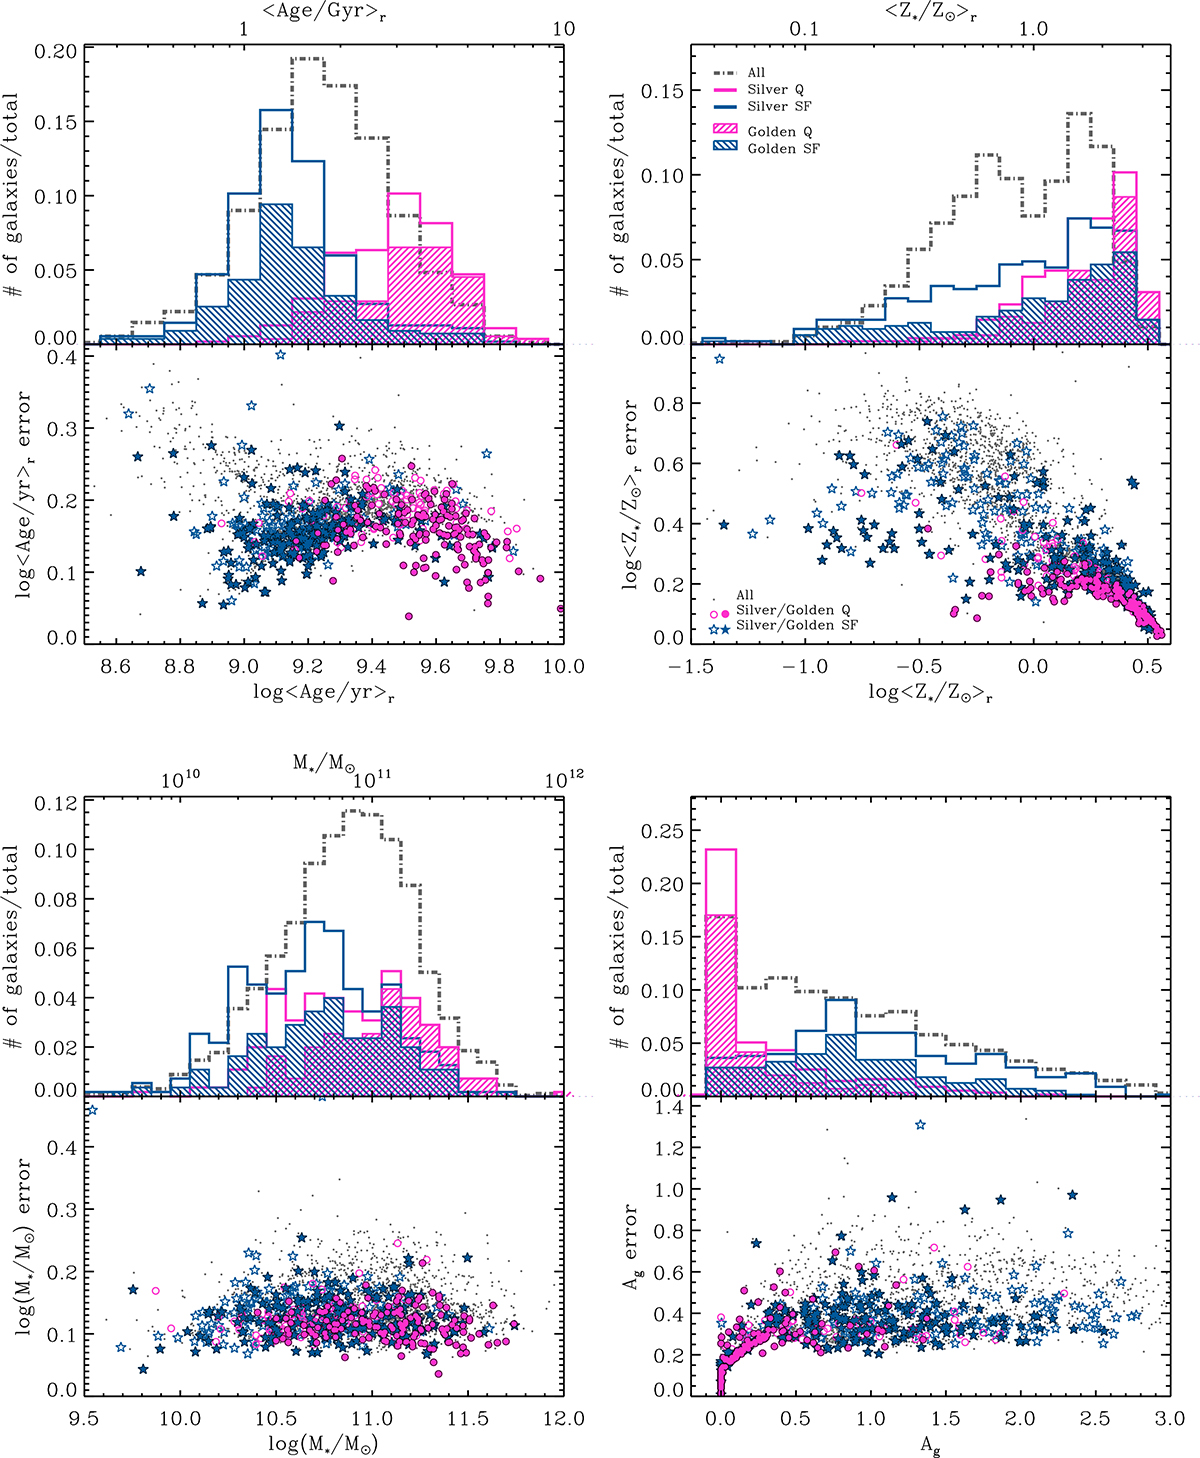
Distribution in r-band light-weighted mean age (upper-left), r-band light-weighted mean stellar metallicity (upper-right), stellar mass (lower-left), and dust attenuation in the g-band (lower-right) for the LEGA-C silver and golden samples analysed in this work. For each parameter, the upper panel displays the distribution in the estimated parameter value (the median of the PDF). Magenta (blue) histograms show the distribution for the Q (SF) galaxies in the silver (hollow) and in the golden (hatched) sub-samples, both normalised to the total silver sample. Grey dot-dashed histograms (normalised to unit integral) display the whole LEGA-C parent sample regardless of the indices used in the fit. The lower panel shows the uncertainties (half of the 84–16 percentile range) in the parameter estimates against the fiducial values. Galaxies belonging to the silver sample are distinguished into Q (magenta circles) and SF (blue stars), with filled symbols highlighting galaxies in the golden sub-sample.
Current usage metrics show cumulative count of Article Views (full-text article views including HTML views, PDF and ePub downloads, according to the available data) and Abstracts Views on Vision4Press platform.
Data correspond to usage on the plateform after 2015. The current usage metrics is available 48-96 hours after online publication and is updated daily on week days.
Initial download of the metrics may take a while.