Fig. 11
Download original image
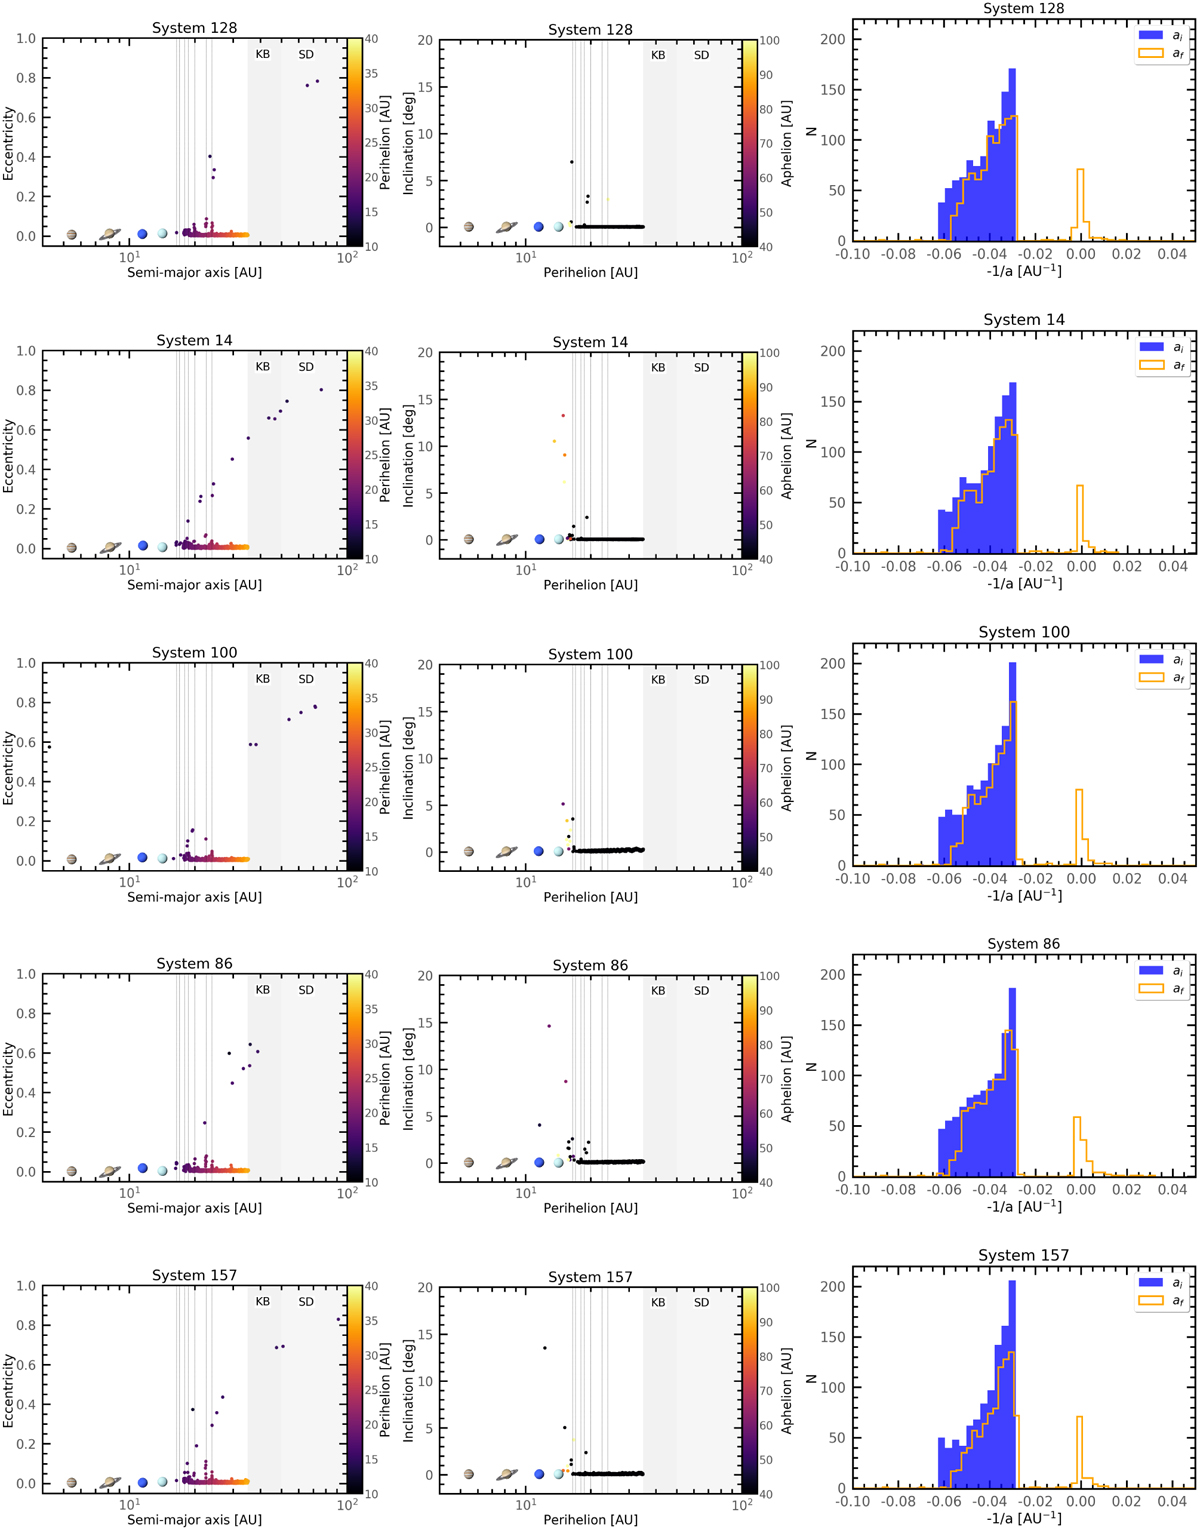
Compact N model. Orbital elements of particles in the disk after 100 Myr and multiple stellar encounters. First column: semimajor axis as a function of eccentricity. The particles are color-coded by their perihelion distances. The green, blue, and gray shaded regions highlight different populations formed due to stellar encounters. Second column: perihelion as a function of orbital inclination. The dots are color-coded by aphelion distance. The gray shaded areas represent distinct regions of the Solar System: Kuiper Belt (KB) and scattered disk (SD). Third column: distribution of orbital energy for the particles. The red histograms correspond to the initial energy distribution, and the blue curve represents the final energy distribution. The blue curves with positive values indicate interstellar comets. The rows (from top to bottom) correspond to systems 128, 14, 100, 86, and 157.
Current usage metrics show cumulative count of Article Views (full-text article views including HTML views, PDF and ePub downloads, according to the available data) and Abstracts Views on Vision4Press platform.
Data correspond to usage on the plateform after 2015. The current usage metrics is available 48-96 hours after online publication and is updated daily on week days.
Initial download of the metrics may take a while.