Fig. A.1
Download original image
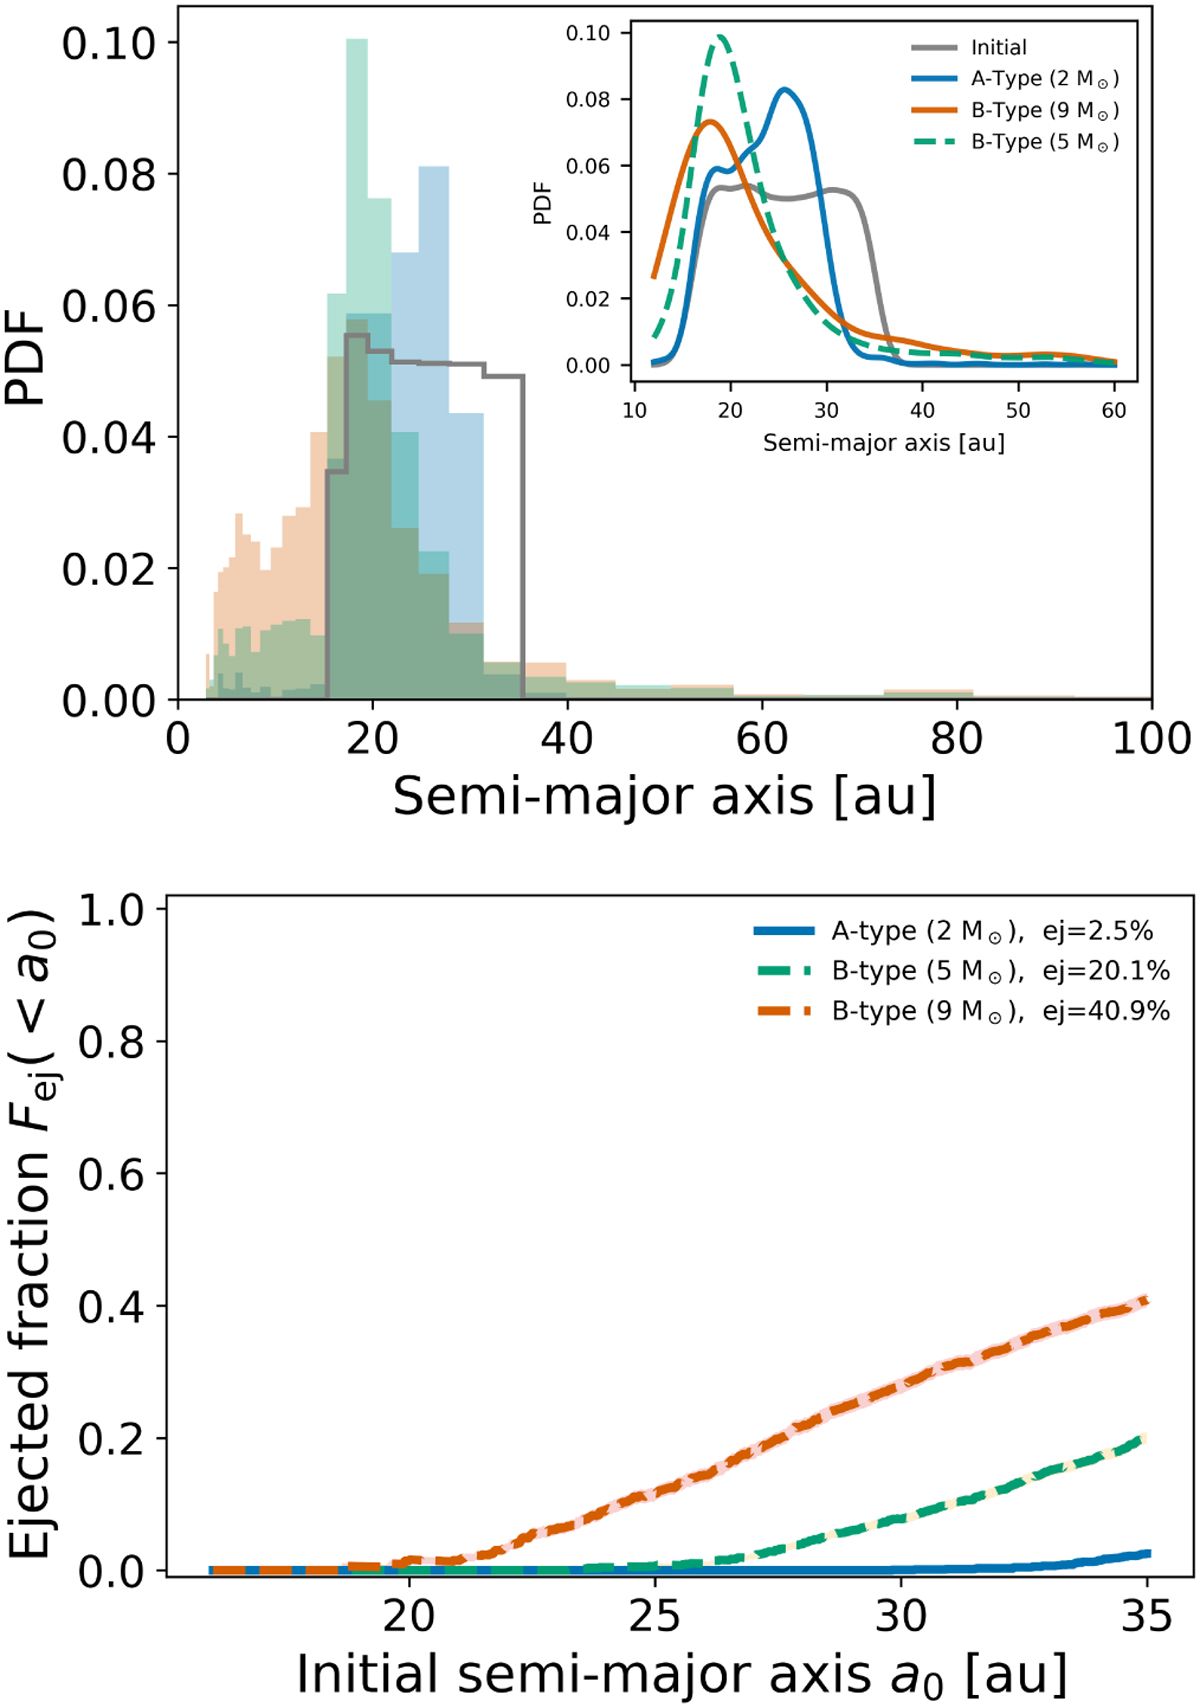
Top: Probability density function vs. semimajor axis for bound particles after a single stellar flyby. The histograms are shown for encounters with an A-type star (2 M⊙, blue), a B-type star (5 M⊙, green dashed and 9 M⊙, orange), compared with the initial disk (gray). The inset shows kernel density estimates (KDEs). Bottom: Cumulative ejection fraction as a function of the initial semimajor axis a0 for the same stellar flybys at a pericenter distance of q⋆ = 90 au.
Current usage metrics show cumulative count of Article Views (full-text article views including HTML views, PDF and ePub downloads, according to the available data) and Abstracts Views on Vision4Press platform.
Data correspond to usage on the plateform after 2015. The current usage metrics is available 48-96 hours after online publication and is updated daily on week days.
Initial download of the metrics may take a while.