Fig. 3
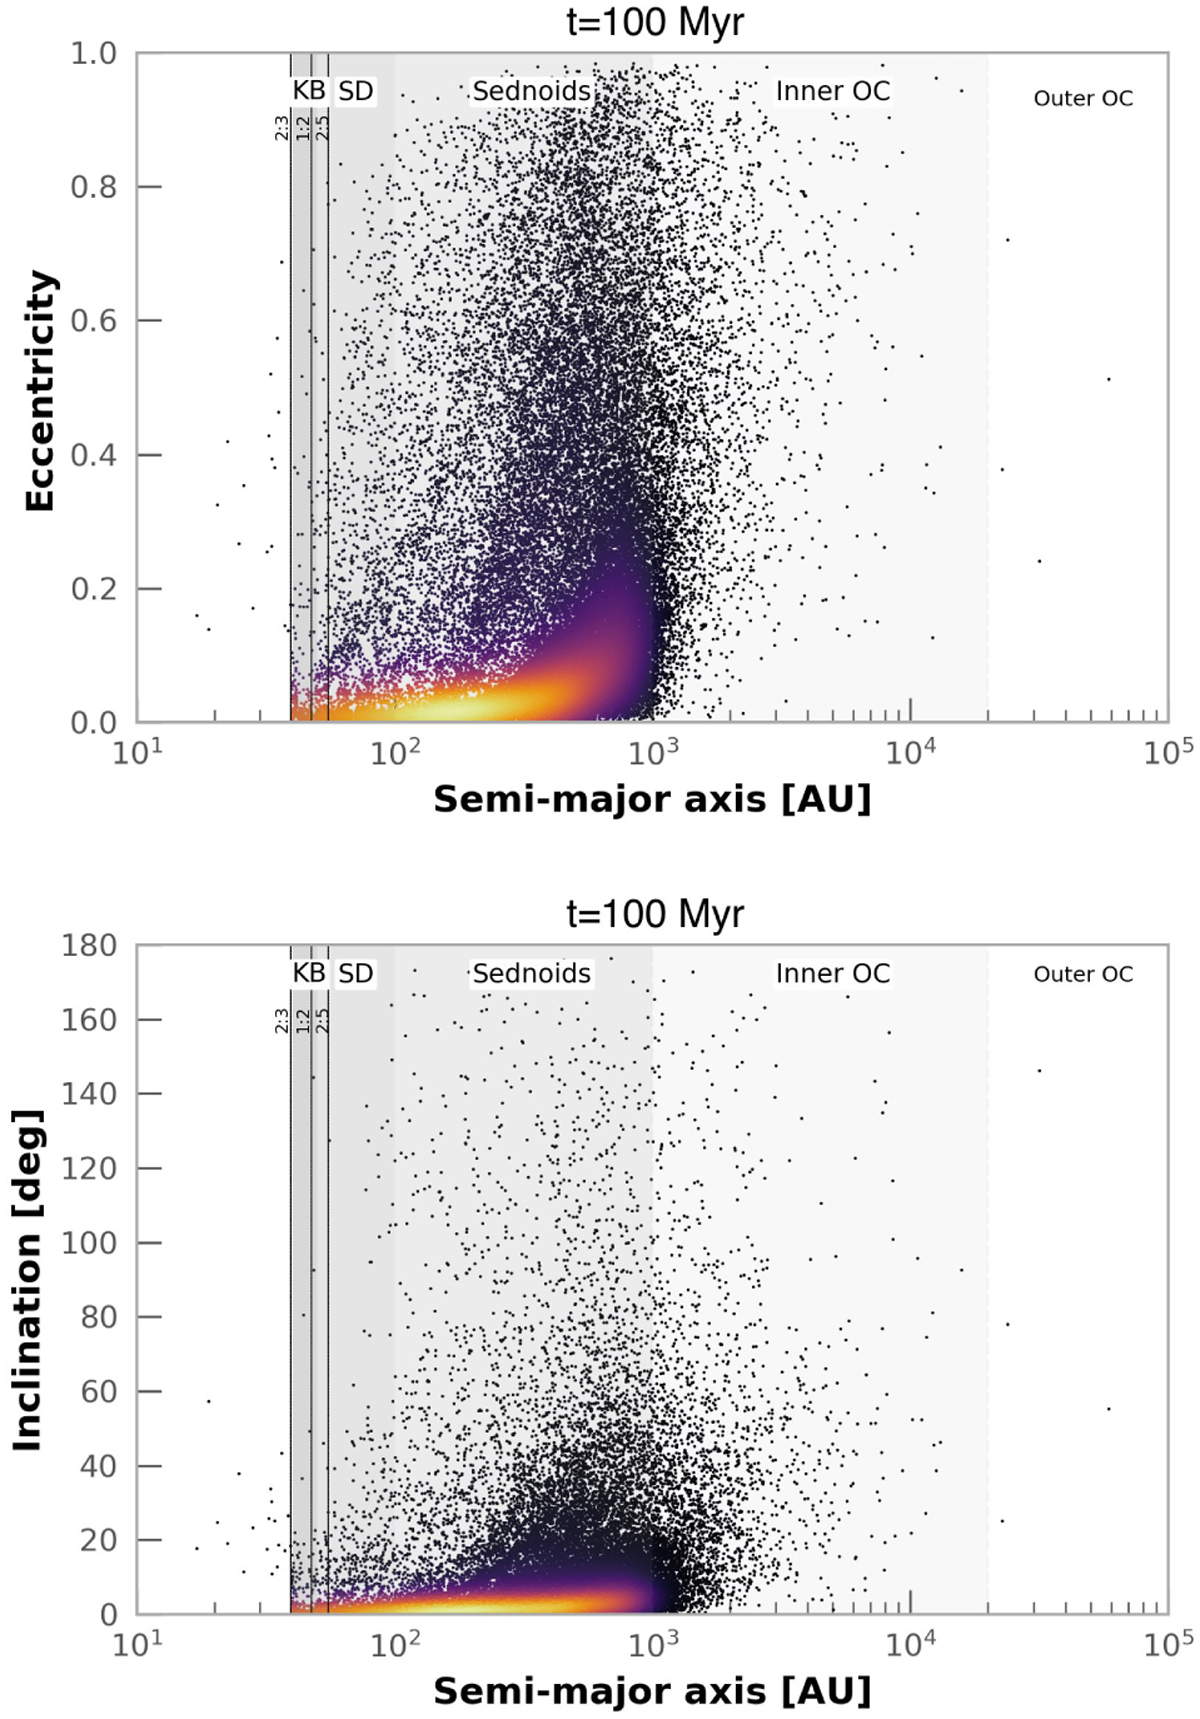
Download original image
Extended N model. Semimajor axis as a function of eccentricity (top panel) and orbital inclination (bottom panel) for all the particles in the 200 simulated systems. The gray areas represent the different regions of the Solar System: Kuiper belt (KB), scattered disk (SD), Sednoids, inner and outer Oort cloud (OC); the dashed lines show the 2:3, 1:2, and 2:5 resonances with Neptune. The integration time is set to 100 Myr. An animation is available online.
Current usage metrics show cumulative count of Article Views (full-text article views including HTML views, PDF and ePub downloads, according to the available data) and Abstracts Views on Vision4Press platform.
Data correspond to usage on the plateform after 2015. The current usage metrics is available 48-96 hours after online publication and is updated daily on week days.
Initial download of the metrics may take a while.