Fig. 1.
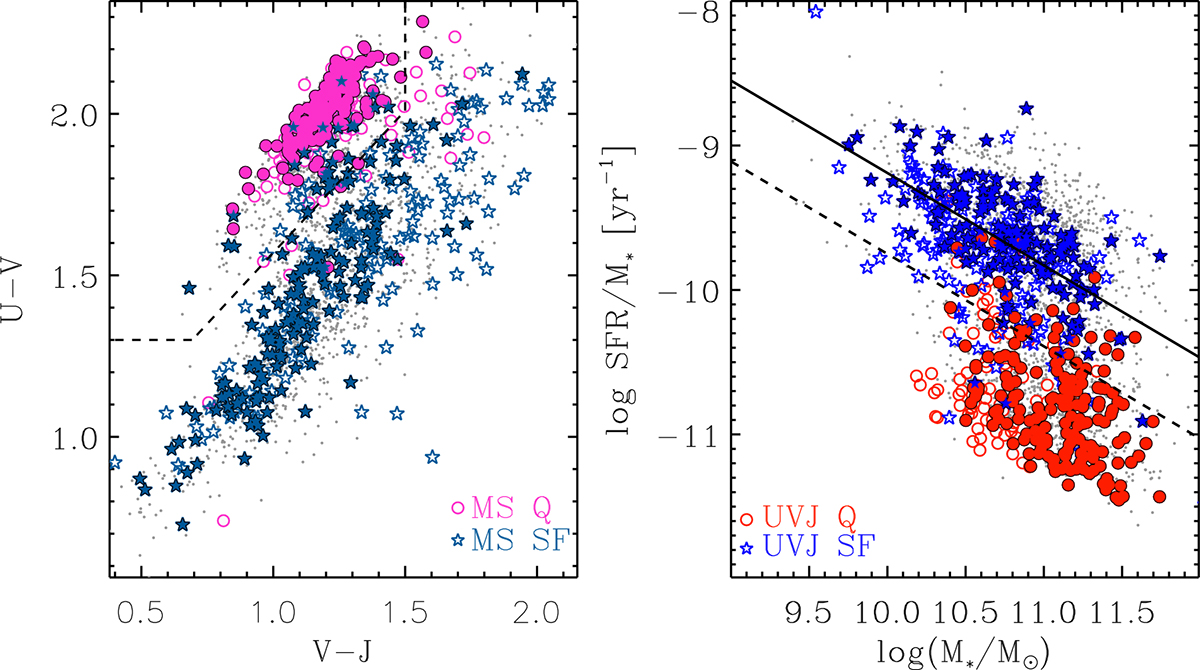
Download original image
Distribution in U − V vs. V − J (left panel) and SSFR vs. M* (right panel) for the parent LEGA-C sample (small dots) and for the silver (empty symbols) and high-S/N golden samples (filled symbols). In the left panel, galaxies are distinguished into Q (magenta) and SF (blue) based on their distance from the star-forming MS, our default classification (i.e. Q galaxies lie below the dashed line in the right panel). In the right panel, red/blue symbols identify Q/SF galaxies according to their location in the UVJ plane (left and right of the dashed line in the right panel, respectively).
Current usage metrics show cumulative count of Article Views (full-text article views including HTML views, PDF and ePub downloads, according to the available data) and Abstracts Views on Vision4Press platform.
Data correspond to usage on the plateform after 2015. The current usage metrics is available 48-96 hours after online publication and is updated daily on week days.
Initial download of the metrics may take a while.