Fig. A.1.
Download original image
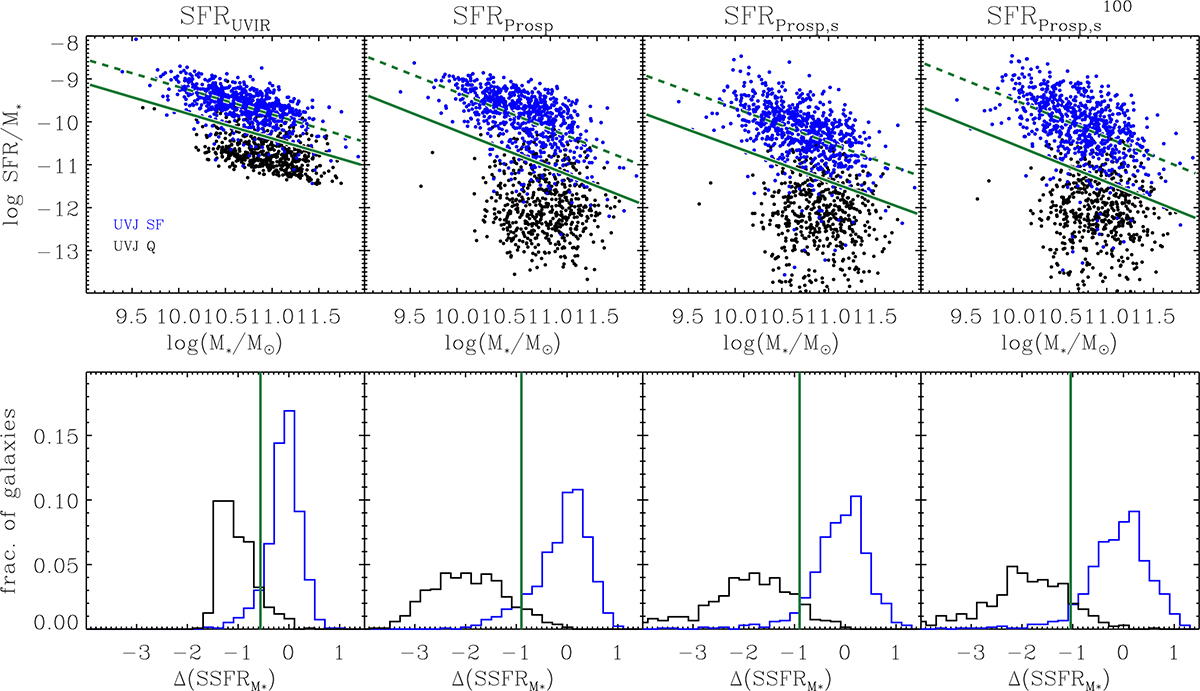
Comparison of Q/SF selection based on different SFR indicators. Galaxies are classified as Q if they lie 2σ below the SSFR−M* relation defined by UVJ-selected SF galaxies (blue points). The upper panels display the SSFR−M* relation for different SFR estimates: our default choice based on UV+24μm (SFRUVIR), estimate from Prospector fit to photometric data (SFRProsp), from Prospector fit to spectrum+photometry instantaneous (SFRProsp,s) or averaged over 100 Myr (![]() ). The dashed and solid green lines indicate the fitted linear relation to UVJ-SF galaxies and its 2σ offset, respectively. The bottom panels show the histograms of distance from the MS for UVJ-SF (blue) and UVJ-Q (black) galaxies, with the selection cut indicated by the vertical green line. In this plot we show all LEGA-C galaxies in the redshift range of the silver sample.
). The dashed and solid green lines indicate the fitted linear relation to UVJ-SF galaxies and its 2σ offset, respectively. The bottom panels show the histograms of distance from the MS for UVJ-SF (blue) and UVJ-Q (black) galaxies, with the selection cut indicated by the vertical green line. In this plot we show all LEGA-C galaxies in the redshift range of the silver sample.
Current usage metrics show cumulative count of Article Views (full-text article views including HTML views, PDF and ePub downloads, according to the available data) and Abstracts Views on Vision4Press platform.
Data correspond to usage on the plateform after 2015. The current usage metrics is available 48-96 hours after online publication and is updated daily on week days.
Initial download of the metrics may take a while.