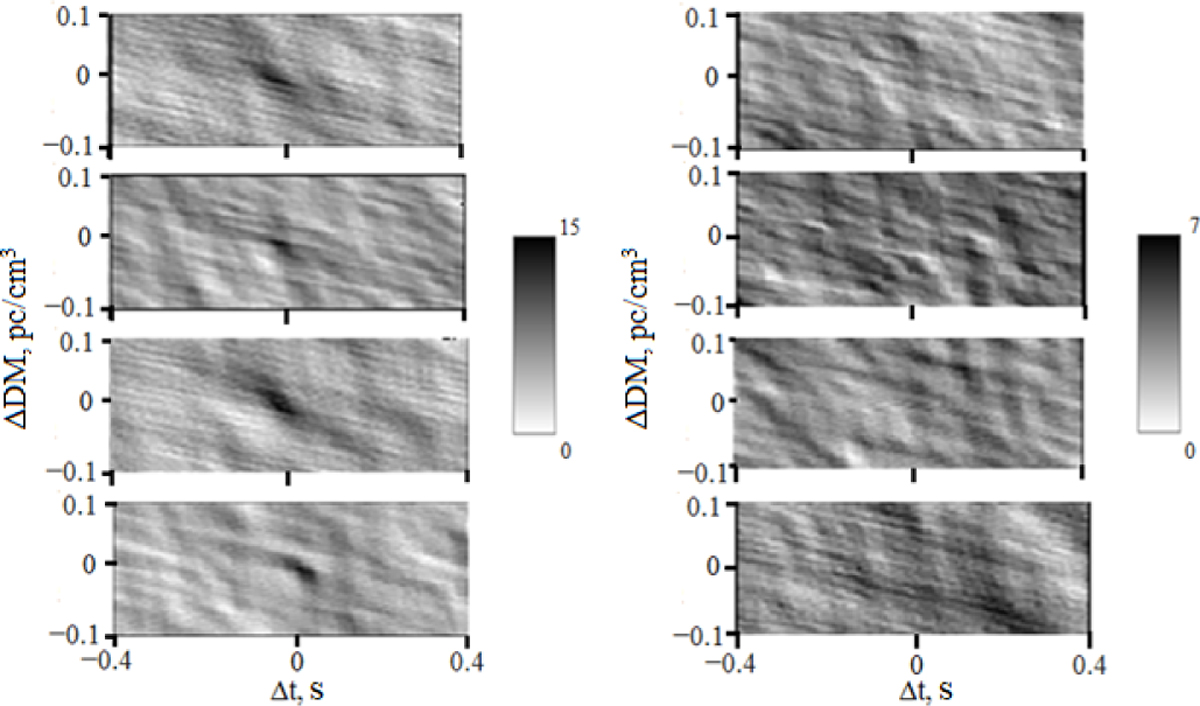
Fig. 12
Download original image
Two-dimensional ‘Time vs DM’ dependences (±0.1 pc/cm3 by DM and ±400 ms – by time). In the left panel, the candidate-signals found in the Survey are shown. In the right one – ‘Time vs DM’ – are dependences for the ‘inverse’ dispersion measure (the dispersion delay is proportional to − f −2). Candidate signals are characterized by the presence of an inclined oval of high intensity in the centre. Such a wide maximum is not observed in the case of ‘signals’ found during the inversion of the spectrograms (adapted from Zakharenko et al. 2018 and Kravtsov 2018).
Current usage metrics show cumulative count of Article Views (full-text article views including HTML views, PDF and ePub downloads, according to the available data) and Abstracts Views on Vision4Press platform.
Data correspond to usage on the plateform after 2015. The current usage metrics is available 48-96 hours after online publication and is updated daily on week days.
Initial download of the metrics may take a while.