Open Access
Fig. 2
Download original image
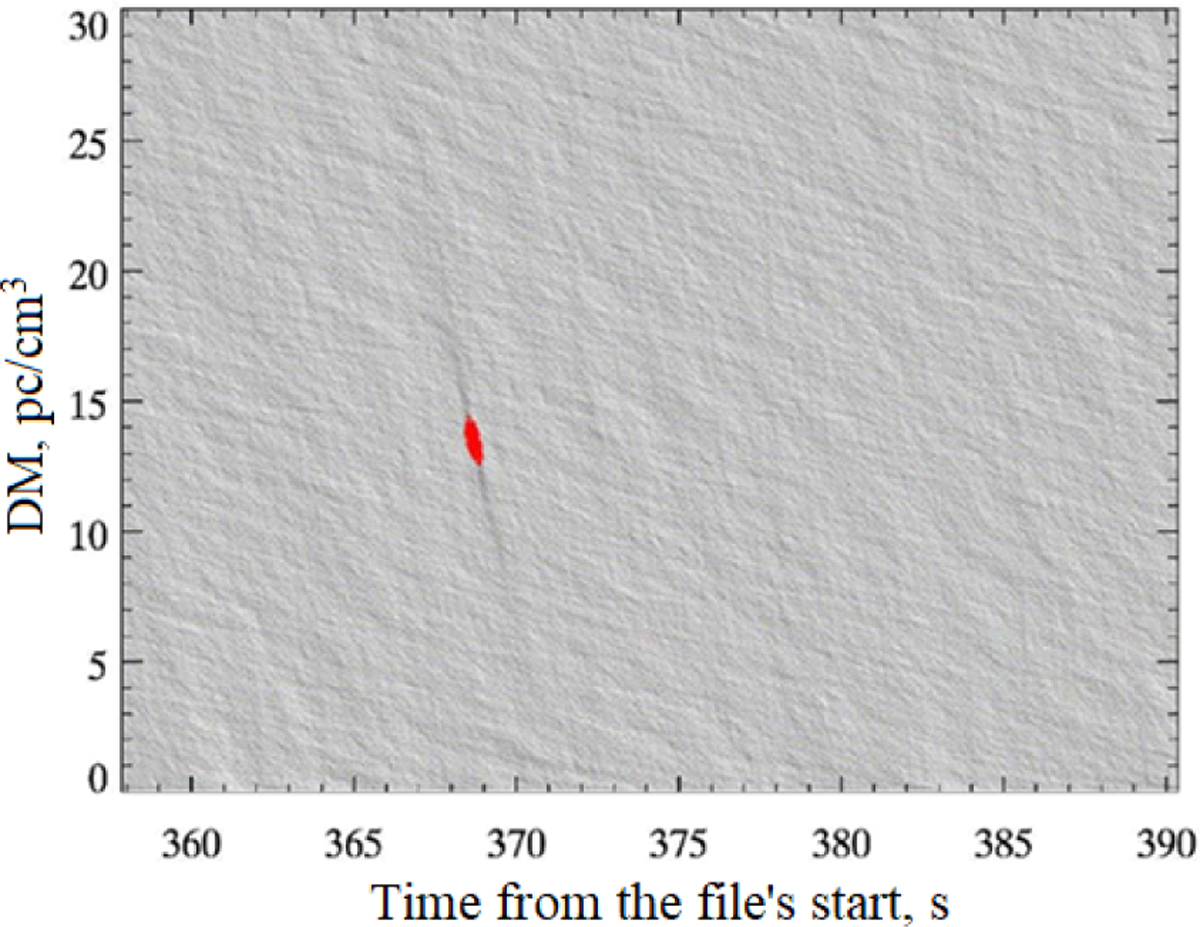
‘Time vs DM’ pulse plane, shown for the signal from the bottom panel in Fig. 1. For the linear frequency dependence (∝ f −1), the ‘dispersion measure’ (when the frequency-integrated signal exceeds the set threshold 5.5 standard deviation) is close to 13.5±0.6 pc/cm3.
Current usage metrics show cumulative count of Article Views (full-text article views including HTML views, PDF and ePub downloads, according to the available data) and Abstracts Views on Vision4Press platform.
Data correspond to usage on the plateform after 2015. The current usage metrics is available 48-96 hours after online publication and is updated daily on week days.
Initial download of the metrics may take a while.