Open Access
Fig. 22
Download original image
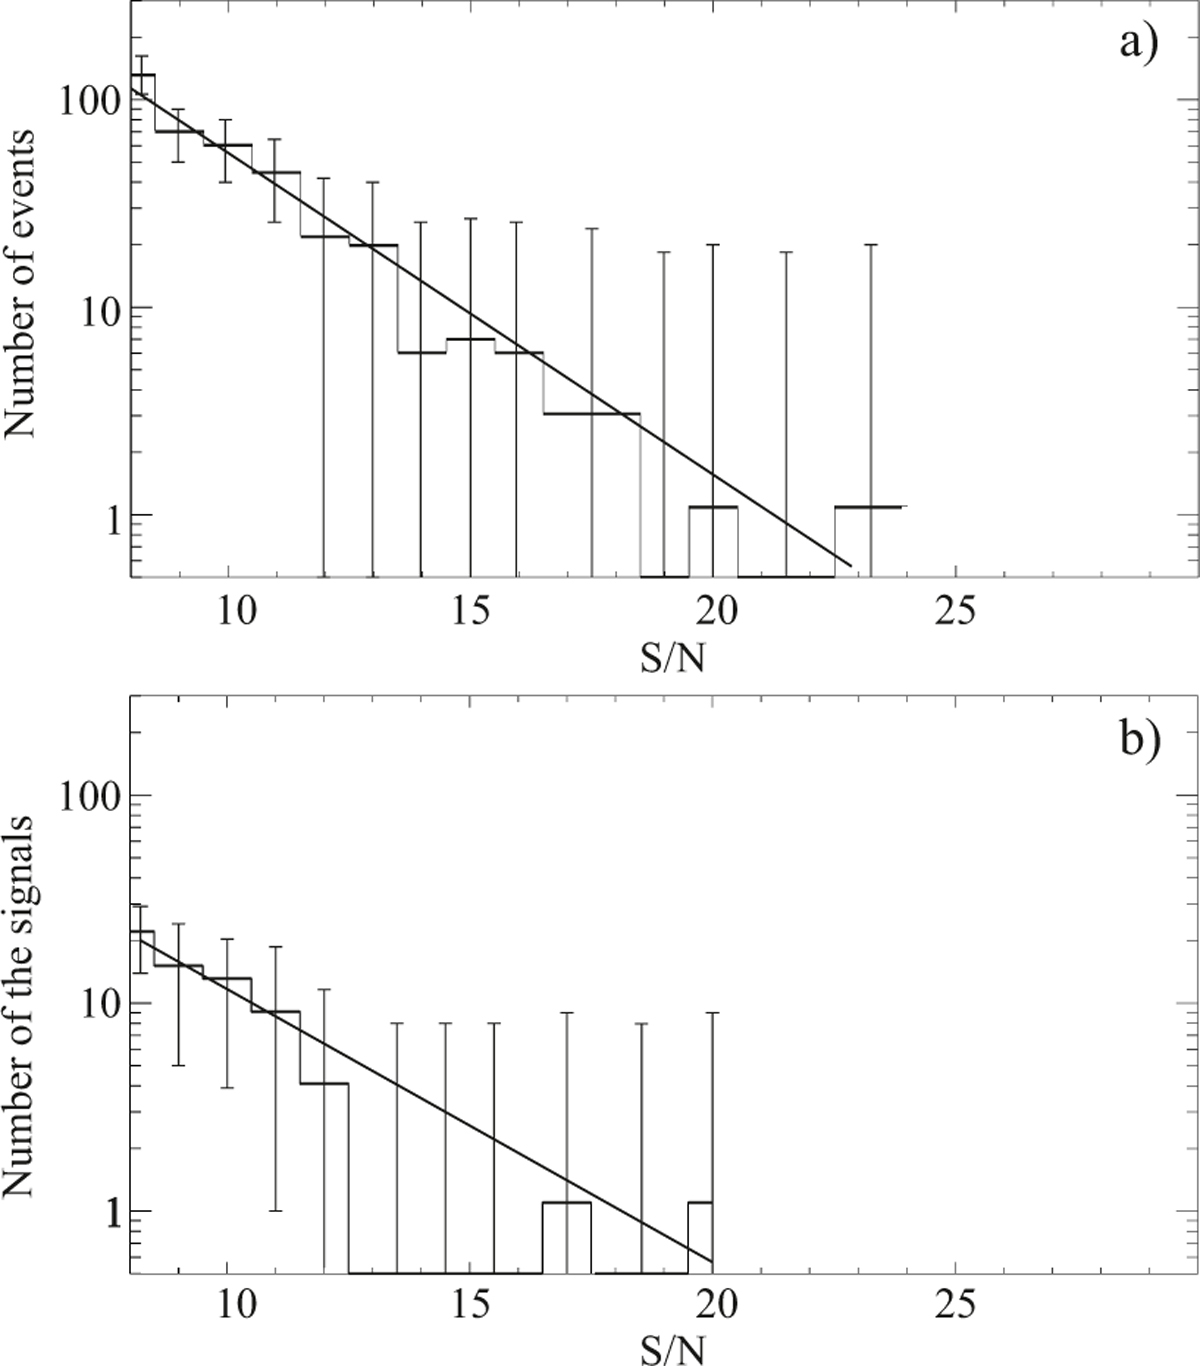
S/N for the detected signals of two surveys: the first complete (a, 380 detections) and the second partial (b, 65 detections). We believe that the ‘gaps’ in histograms are related to the low signal statistics.
Current usage metrics show cumulative count of Article Views (full-text article views including HTML views, PDF and ePub downloads, according to the available data) and Abstracts Views on Vision4Press platform.
Data correspond to usage on the plateform after 2015. The current usage metrics is available 48-96 hours after online publication and is updated daily on week days.
Initial download of the metrics may take a while.