Open Access
Fig. 23
Download original image
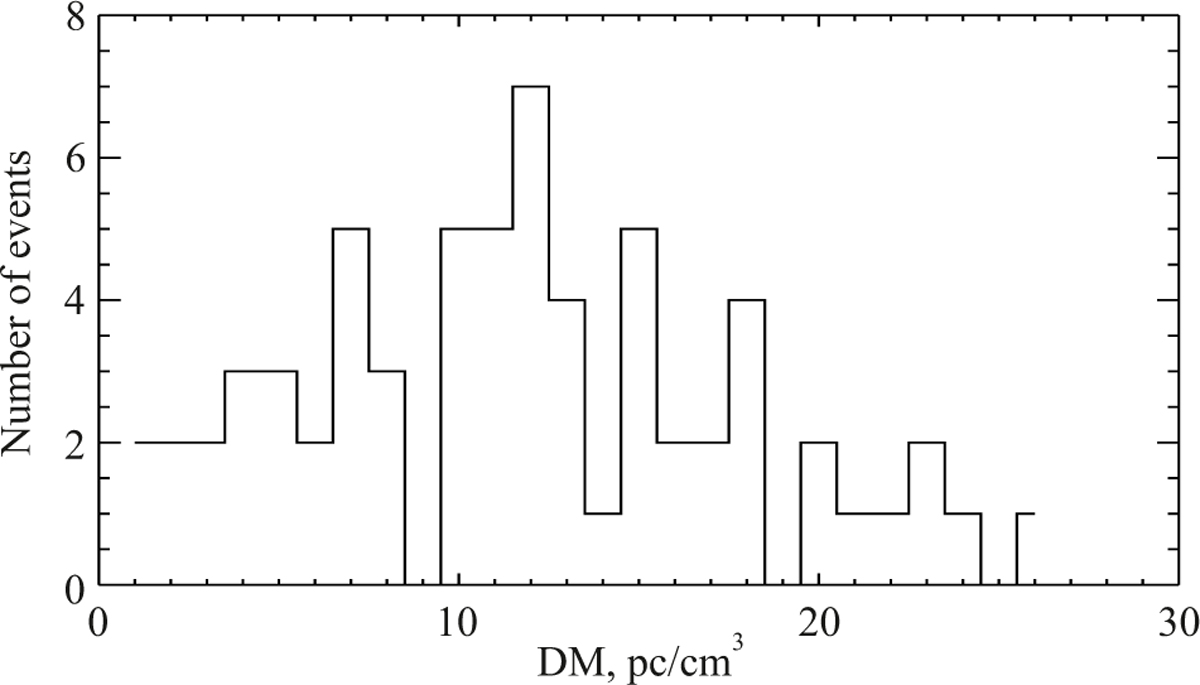
DM distribution of 65 detections, found during the repeated (partial) survey. In comparison the DM distribution of 380 detections with S/N > 8 detected in the Survey can be seen in Fig. 16a.
Current usage metrics show cumulative count of Article Views (full-text article views including HTML views, PDF and ePub downloads, according to the available data) and Abstracts Views on Vision4Press platform.
Data correspond to usage on the plateform after 2015. The current usage metrics is available 48-96 hours after online publication and is updated daily on week days.
Initial download of the metrics may take a while.