Fig. 10
Download original image
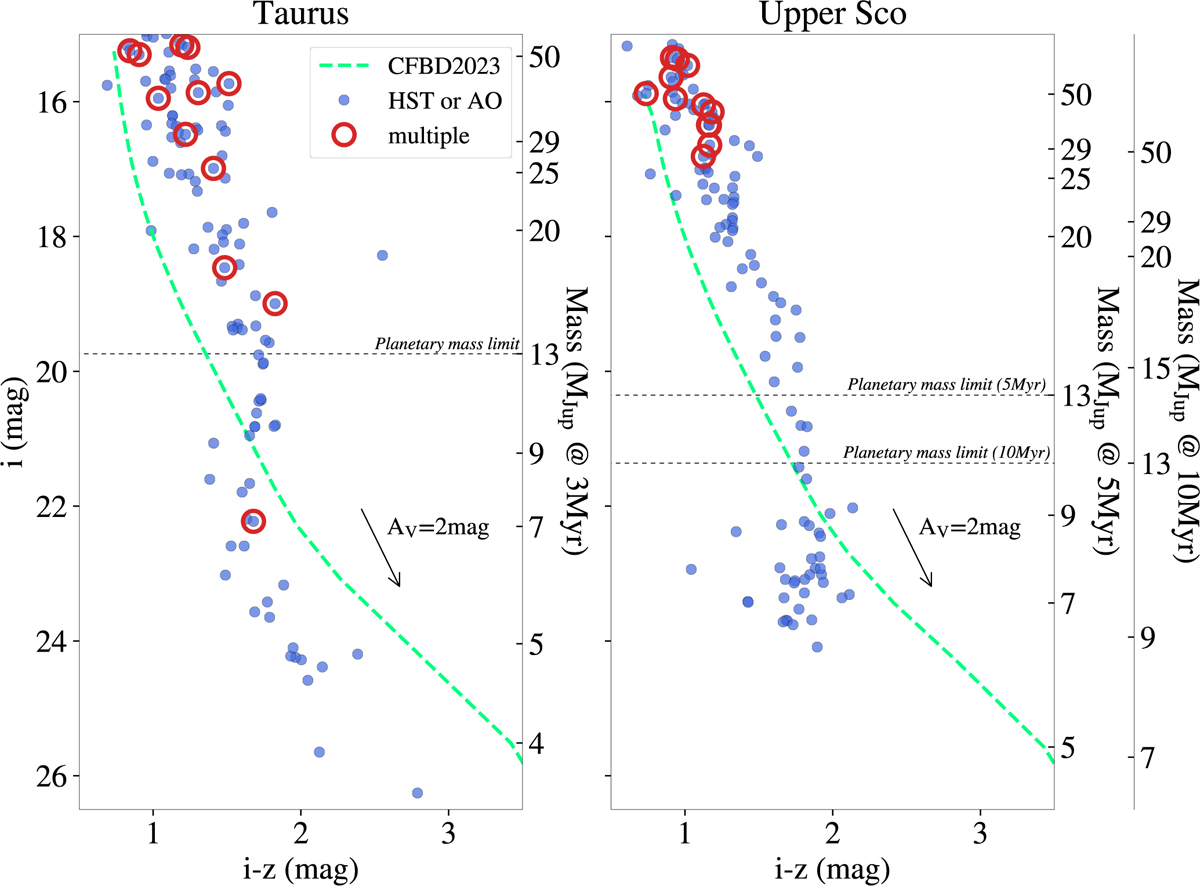
(i, i-z) diagram of Taurus members (left panel) and USco members (right) observed at high spatial resolution using either HST or adaptive optics (blue dots) by Todorov et al. (2010, 2014); Bouy et al. (2006); Biller et al. (2011); Kraus & Hillenbrand (2012); Kraus et al. (2006); Konopacky et al. (2007), as well as this work. The Chabrier et al. (2023) isochrones at 3 Myr (Taurus) and 5 and 10 Myr (USco) 140pc are represented by a dashed green line and the corresponding masses are indicated on the right vertical axis. The 5 and 10 Myr isochrones overlap almost perfectly and are represented as one in the USco panel. Resolved binaries are over-plotted as open red circles. A reddening vector AV = 2 mag is also represented. See also Table C.2 and C.1.
Current usage metrics show cumulative count of Article Views (full-text article views including HTML views, PDF and ePub downloads, according to the available data) and Abstracts Views on Vision4Press platform.
Data correspond to usage on the plateform after 2015. The current usage metrics is available 48-96 hours after online publication and is updated daily on week days.
Initial download of the metrics may take a while.