Fig. 2
Download original image
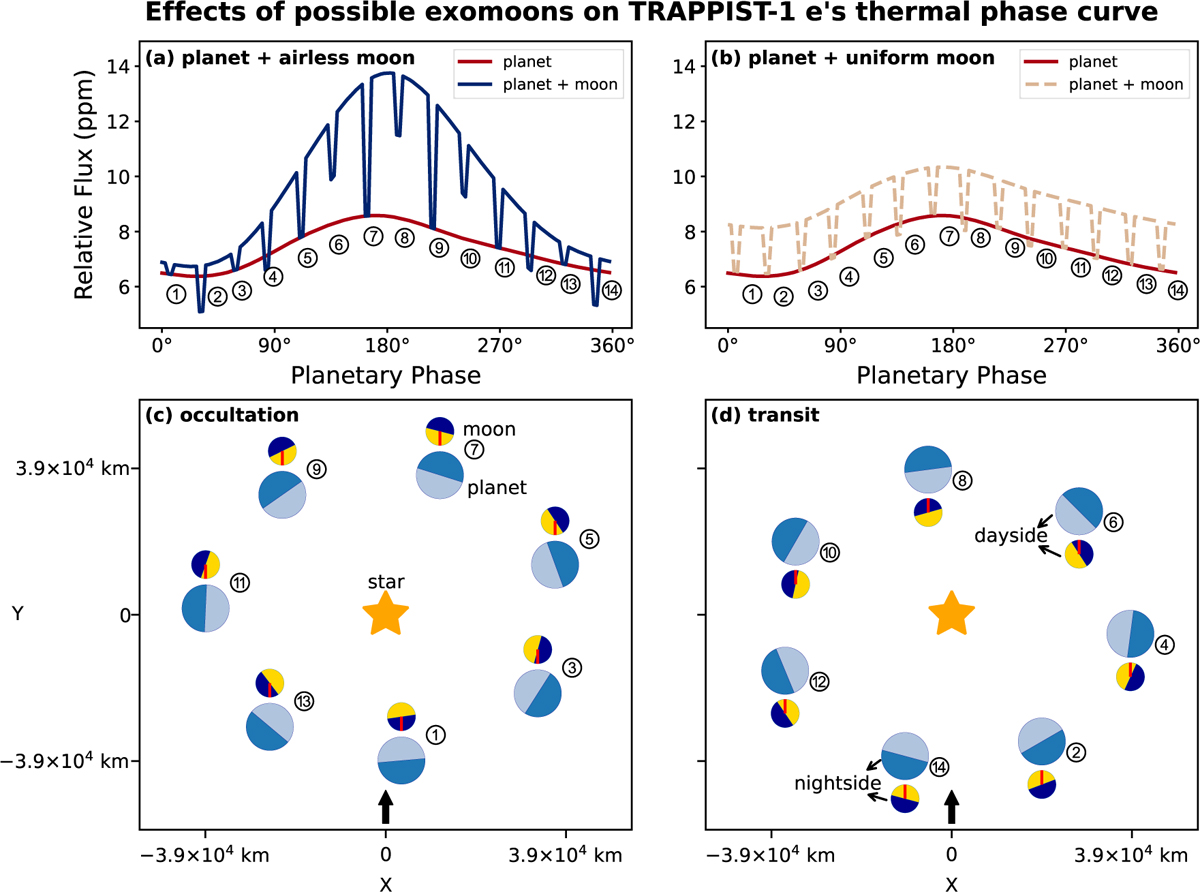
Thermal phase curves and eclipses for the TRAPPIST-1 e system. Panel a: total thermal phase curve of the planet and a 3000 km tidally locked airless exomoon (blue line). Panel b: total thermal phase curve of the planet and a 3000 km exomoon with uniform temperature (dashed line). The exomoons orbit at 33 300 km around TRAPPIST-1 e. The red lines in panels (a) and (b) show the planetary phase curve alone, i.e. the ratio of the planetary infrared emission to the stellar infrared emission. Panel c: occultation scenarios, with the exomoon blocked by the planet. The red indicators on the exomoon markers show the 180° longitude. Panel d: transit scenarios, with the exoplanet blocked by the exomoon. The observation direction in panels (c) and (d) is from bottom to top, as indicated by the black arrows at the bottom.
Current usage metrics show cumulative count of Article Views (full-text article views including HTML views, PDF and ePub downloads, according to the available data) and Abstracts Views on Vision4Press platform.
Data correspond to usage on the plateform after 2015. The current usage metrics is available 48-96 hours after online publication and is updated daily on week days.
Initial download of the metrics may take a while.