Fig. 8
Download original image
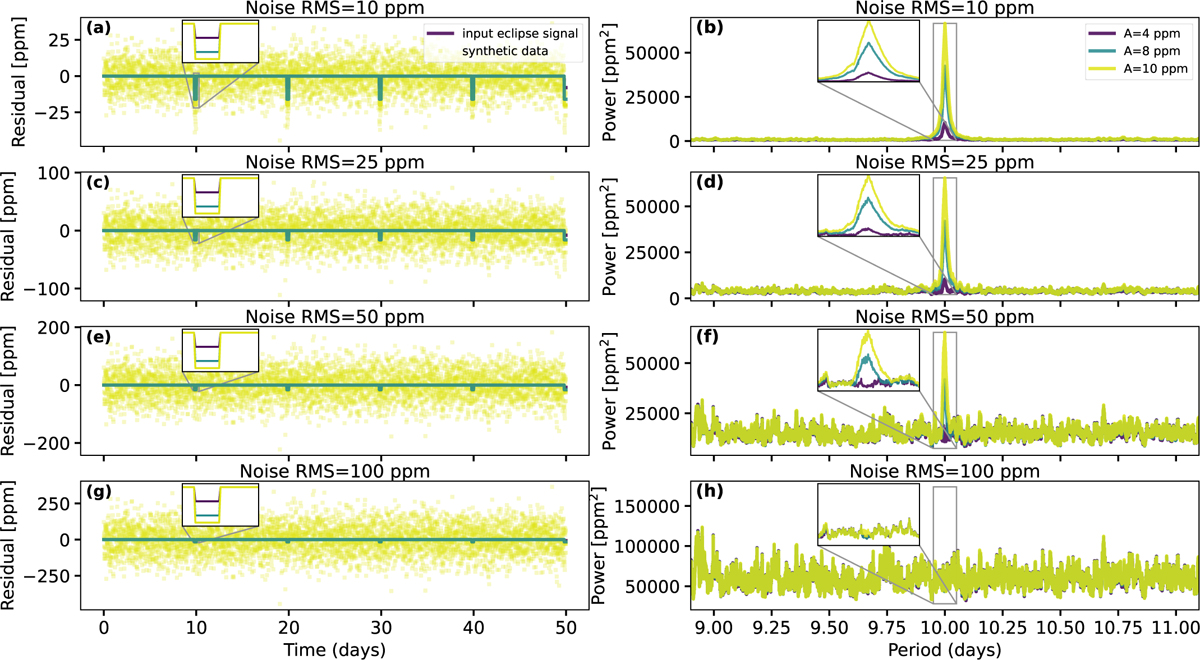
Synthetic exomoon-exoplanet mutual eclipse signals (left column) and their according periodograms (right column). Each row corresponds to a different white noise level, with RMS values ranging from 10 to 100 ppm. The dots in the left column shows the injected signals combined with noise. Different colours represent different exomoon thermal phase curve amplitudes (A), from 2 ppm to 10 ppm. The solid lines in the right column show the corresponding periodograms. Each hypothetical signal has a sampling frequency of 15 minutes and a total observation time of 180 days.
Current usage metrics show cumulative count of Article Views (full-text article views including HTML views, PDF and ePub downloads, according to the available data) and Abstracts Views on Vision4Press platform.
Data correspond to usage on the plateform after 2015. The current usage metrics is available 48-96 hours after online publication and is updated daily on week days.
Initial download of the metrics may take a while.