Open Access
Fig. 7
Download original image
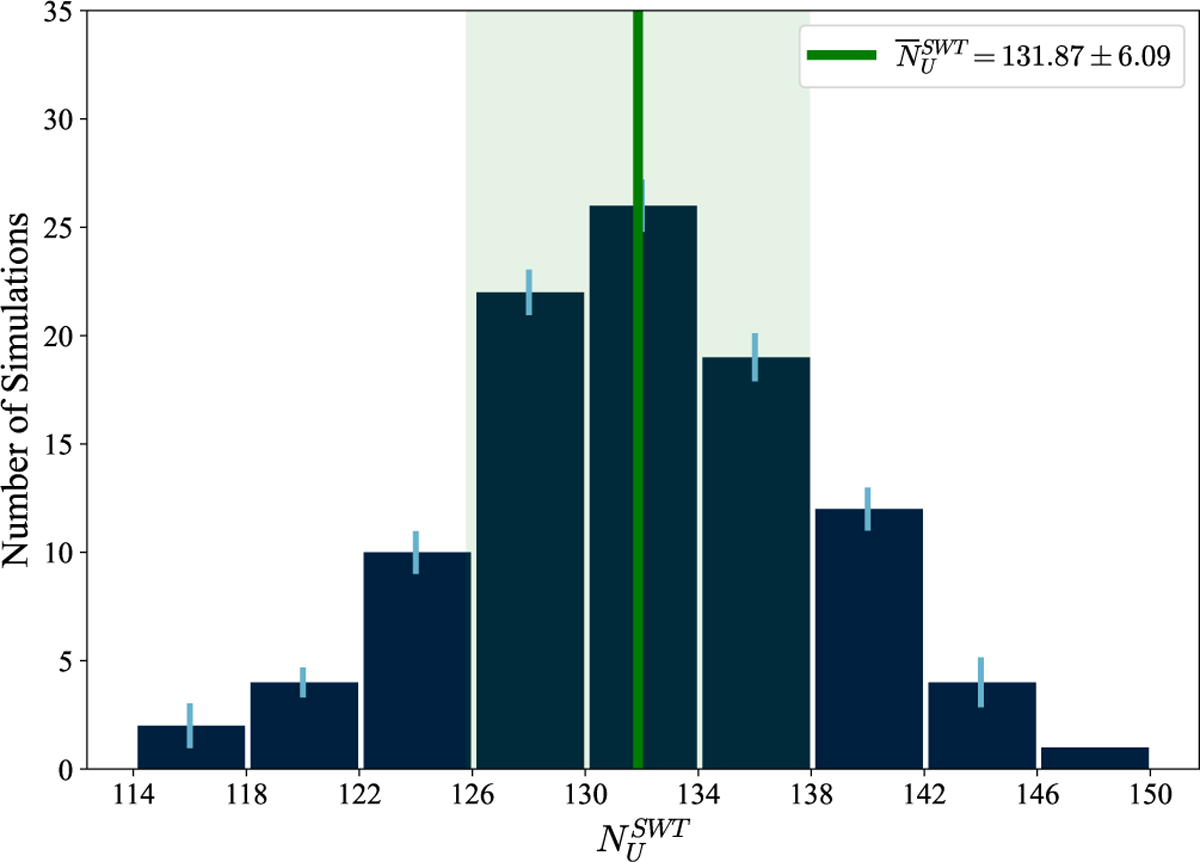
Distribution of the number of unmerged IMBHs across the 100 A-SLOTH simulations for the SWT SFR. Light blue lines indicate the standard deviation for each bin.
Current usage metrics show cumulative count of Article Views (full-text article views including HTML views, PDF and ePub downloads, according to the available data) and Abstracts Views on Vision4Press platform.
Data correspond to usage on the plateform after 2015. The current usage metrics is available 48-96 hours after online publication and is updated daily on week days.
Initial download of the metrics may take a while.