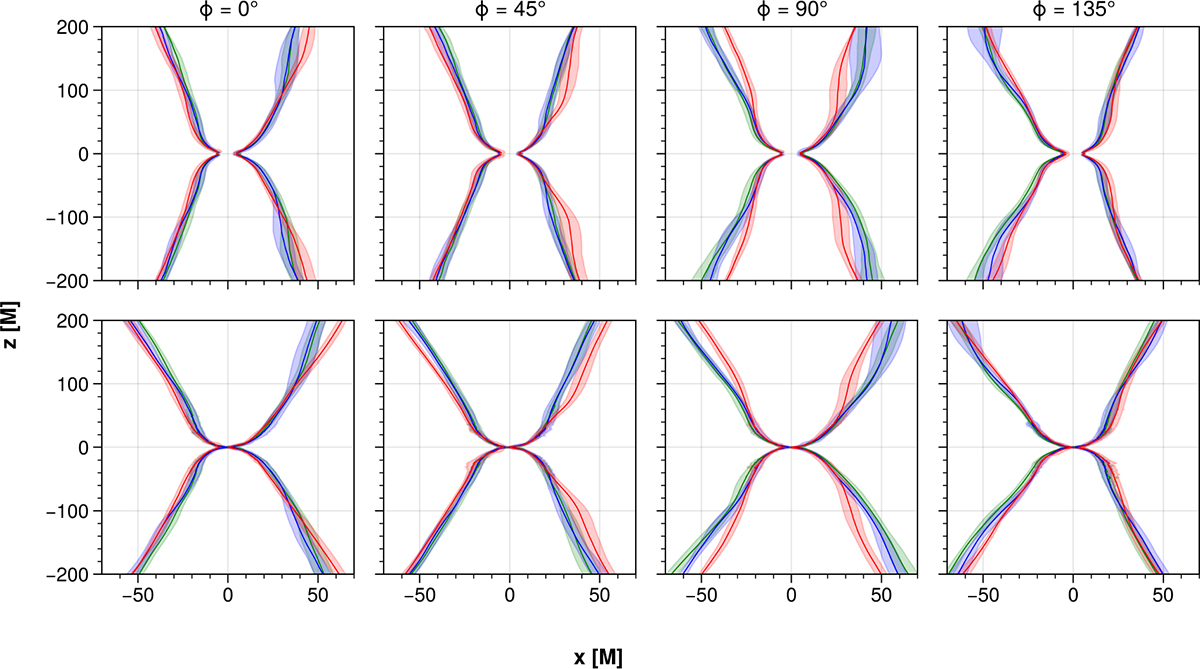
Fig. 10.
Download original image
Upper row: σ = 1 contours in xz-cross-section corresponding to K.80 (green lines), K.90 (blue lines), and K.99 (red lines), and the 1σ standard deviation in the x-directions over the time intervals listed in Table 2. Each column presents poloidal cross-sections at azimuthal angles in 45° increments. Bottom row: Bernoulli parameter −hut = 1.02 contours, where we otherwise show the exact analogs for it as in the σ = 1 contours.
Current usage metrics show cumulative count of Article Views (full-text article views including HTML views, PDF and ePub downloads, according to the available data) and Abstracts Views on Vision4Press platform.
Data correspond to usage on the plateform after 2015. The current usage metrics is available 48-96 hours after online publication and is updated daily on week days.
Initial download of the metrics may take a while.