Open Access
Fig. 13.
Download original image
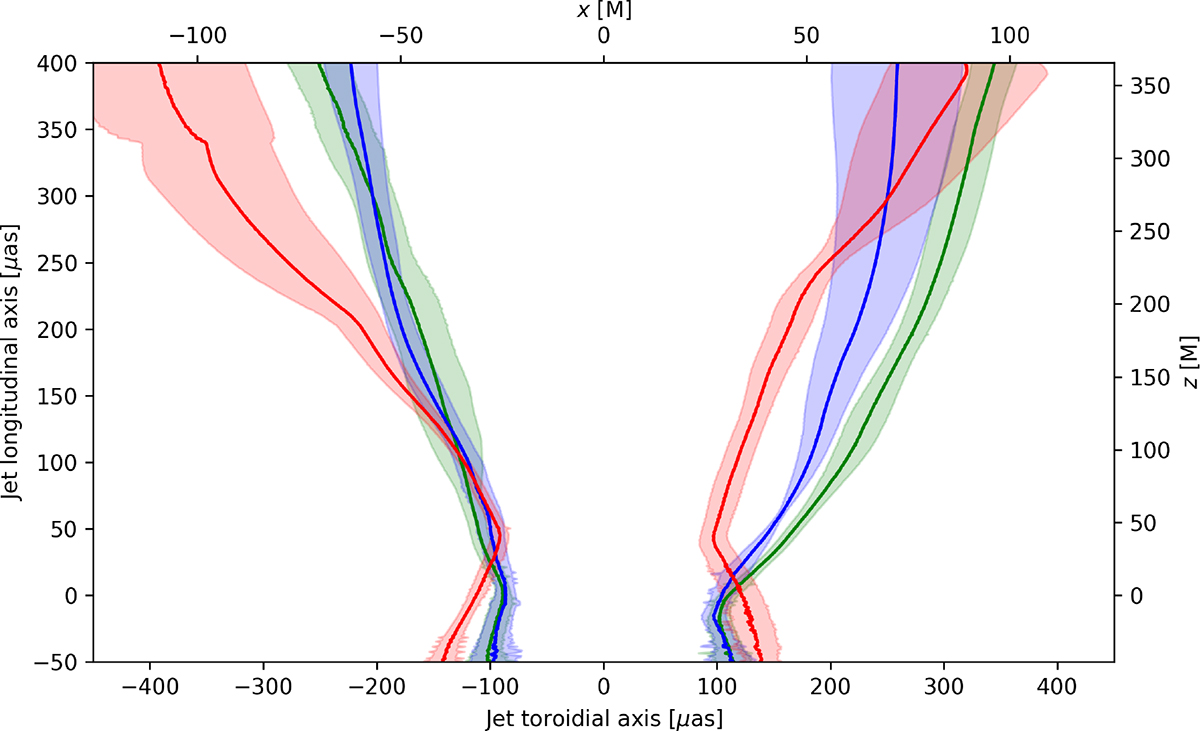
⟨I⟩ = 5 × 10⁻⁶ [Jy] contours of time-averaged 86 GHz ray tracings (not the line integral convolved images shown in Fig. 11) for simulations K.80 (green), K.90 (blue), and K.99 (red). The colored areas are 1σ bands of the standard deviations in the toroidal direction.
Current usage metrics show cumulative count of Article Views (full-text article views including HTML views, PDF and ePub downloads, according to the available data) and Abstracts Views on Vision4Press platform.
Data correspond to usage on the plateform after 2015. The current usage metrics is available 48-96 hours after online publication and is updated daily on week days.
Initial download of the metrics may take a while.