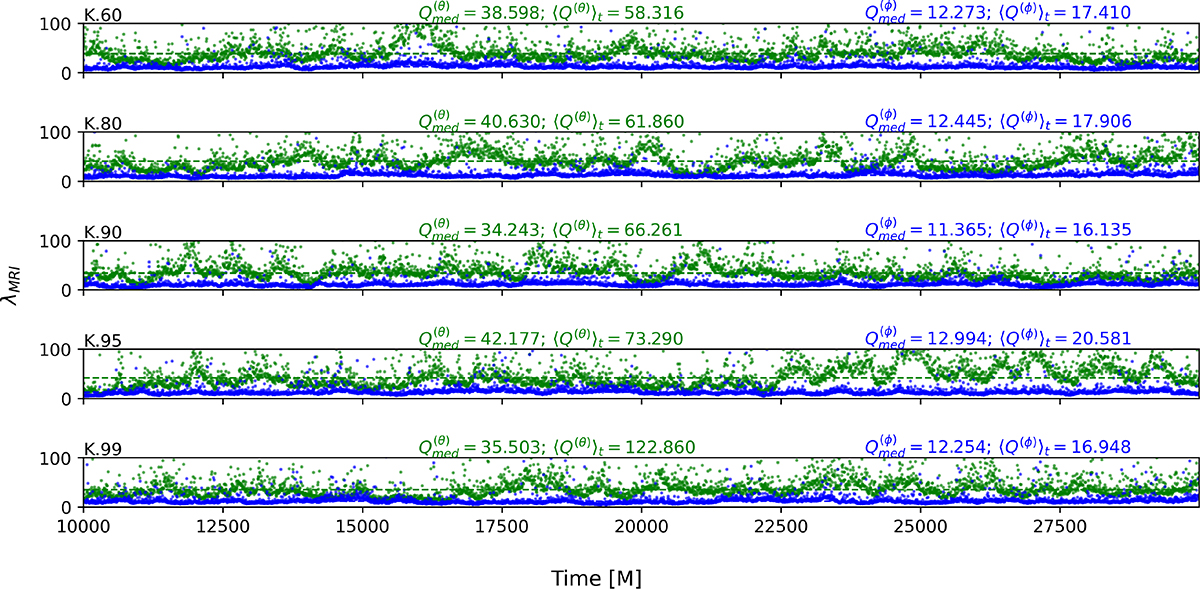
Fig. D.1.
Download original image
Disk averaged MRI quality factors in θ and ϕ of each simulation, row-wise. Dashed lines are the median values taken over the time span shown in the graphs. Besides the median values we also give corresponding time averaged values. Due to the skewed nature of the temporal distriubtion of the disk averaged Q factors, the median is more appropriate for interpretation. It is noted that for Q(θ) ∼ (3 − 6)% of points lie outside the graph, i.e. are above 100 in the three simulations. For Q(ϕ) ∼ 1% are concerned.
Current usage metrics show cumulative count of Article Views (full-text article views including HTML views, PDF and ePub downloads, according to the available data) and Abstracts Views on Vision4Press platform.
Data correspond to usage on the plateform after 2015. The current usage metrics is available 48-96 hours after online publication and is updated daily on week days.
Initial download of the metrics may take a while.