Fig. D.2.
Download original image
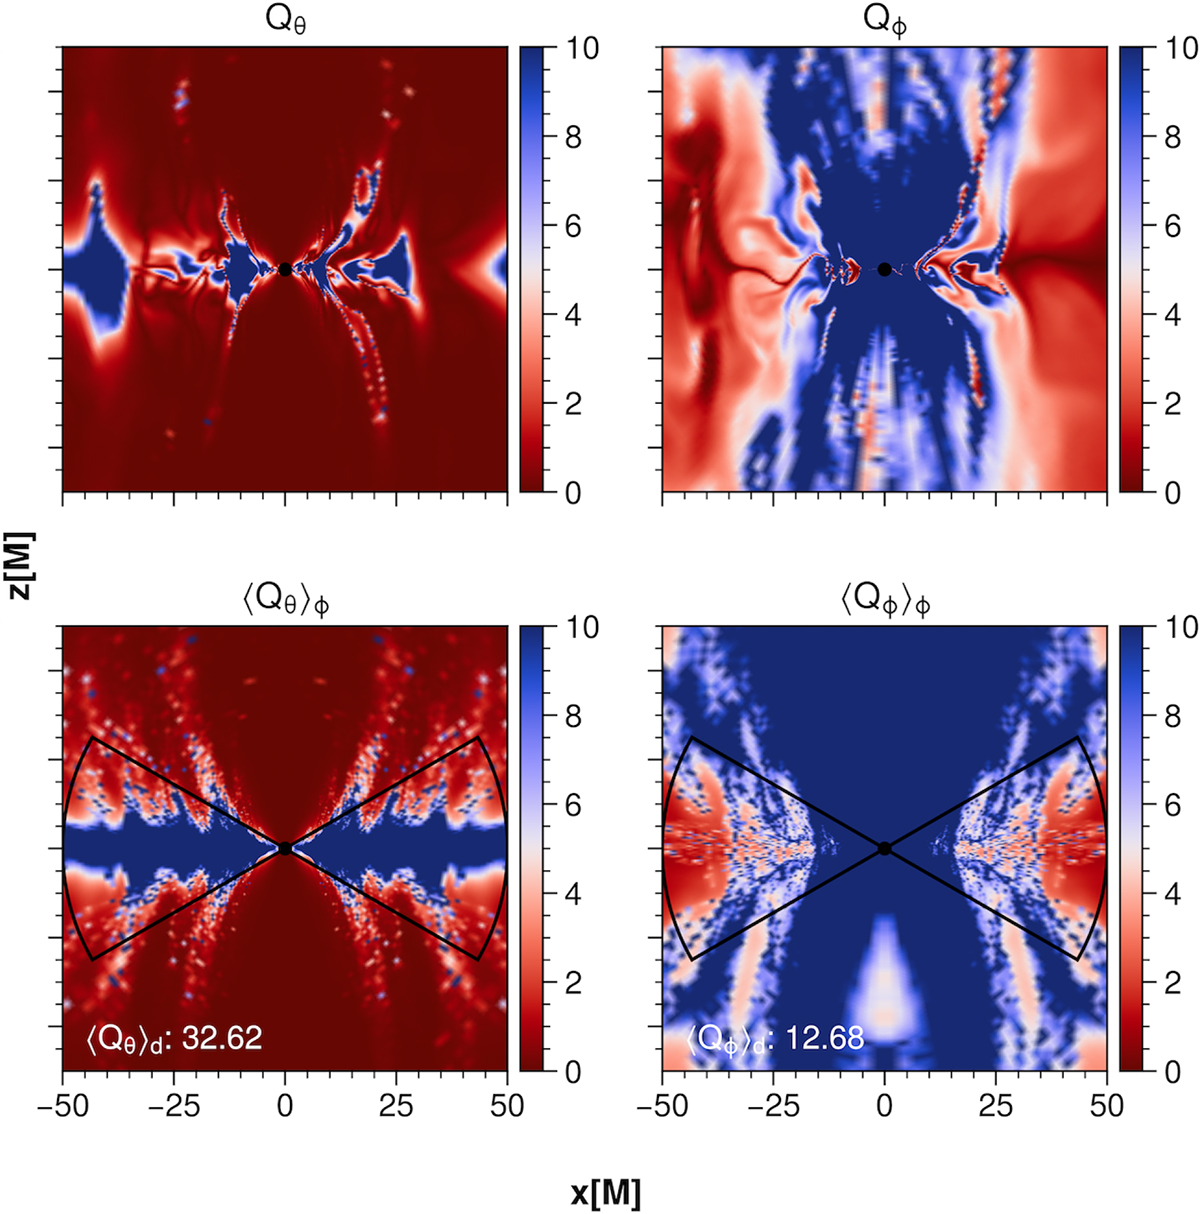
Meridional cross-section of MRI Quality factors in θ and ϕ directions. Top row: Meridional cross-section. Bottom row: Volume averaged Q factors over the full azimuthal angle. The black lines indicate the regions where the disk is cut, poloidally, and subsequently averaged over the full azimuthal angle to obtain the disk averaged values given in the bottom left corners.
Current usage metrics show cumulative count of Article Views (full-text article views including HTML views, PDF and ePub downloads, according to the available data) and Abstracts Views on Vision4Press platform.
Data correspond to usage on the plateform after 2015. The current usage metrics is available 48-96 hours after online publication and is updated daily on week days.
Initial download of the metrics may take a while.