Open Access
Fig. 3.
Download original image
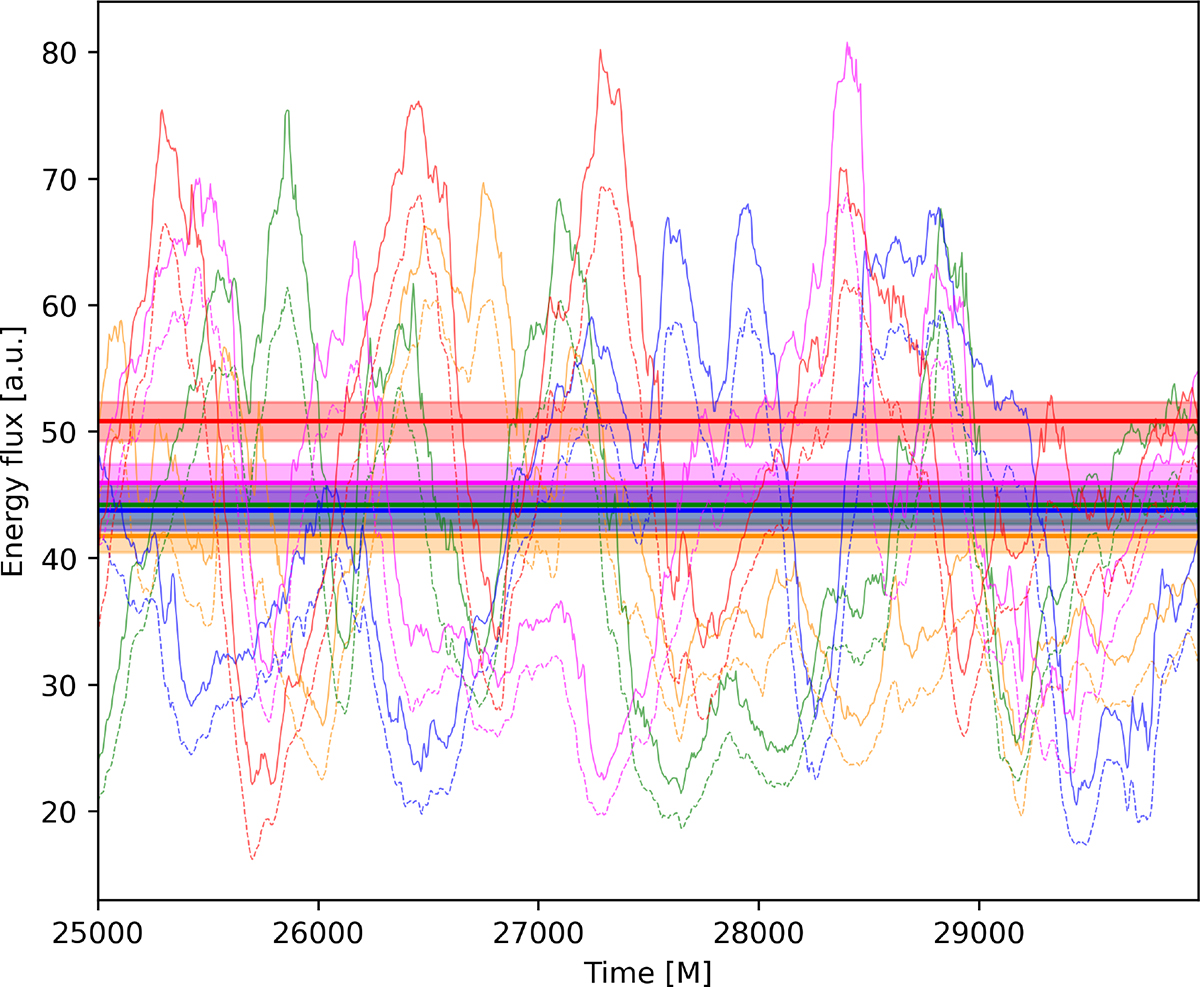
Temporal evolution of total energy flux (solid lines) and EM energy flux (dashed lines) measured at r = 10 M in the jet for simulations K.60 (orange), K.80 (green), K.90 (blue), K.95 (magenta), and K.99 (red). The horizontal lines show the average of the total energy fluxes for each run over the shown time interval.
Current usage metrics show cumulative count of Article Views (full-text article views including HTML views, PDF and ePub downloads, according to the available data) and Abstracts Views on Vision4Press platform.
Data correspond to usage on the plateform after 2015. The current usage metrics is available 48-96 hours after online publication and is updated daily on week days.
Initial download of the metrics may take a while.