Fig. 6.
Download original image
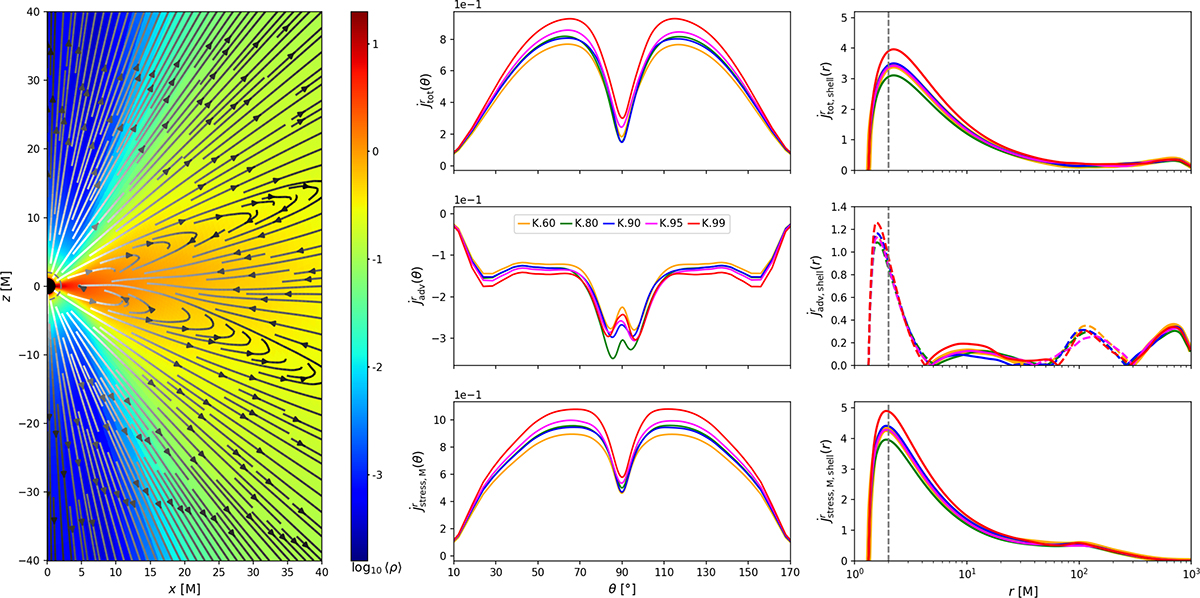
Left panel: Time- and azimuthally averaged density distribution in the meridional plane and total angular-momentum flux streamlines (color-coded by a log-scale of the absolute value; increasing from black to white; simulation: K.80). Middle column: Polar slices of the radial angular-momentum flux at r = 2 M, indicated by the dashed gray lines in the left panel and right column. Shown are the total, advective and Maxwell-stress-induced angular-momentum fluxes from top to bottom. Right column: Shell-integrated radial component of the angular-momentum fluxes. Solid lines indicate positive values, i.e., outward fluxes and dashed lines are the absolute values of inward (negative) flux.
Current usage metrics show cumulative count of Article Views (full-text article views including HTML views, PDF and ePub downloads, according to the available data) and Abstracts Views on Vision4Press platform.
Data correspond to usage on the plateform after 2015. The current usage metrics is available 48-96 hours after online publication and is updated daily on week days.
Initial download of the metrics may take a while.