Open Access
Fig. 9.
Download original image
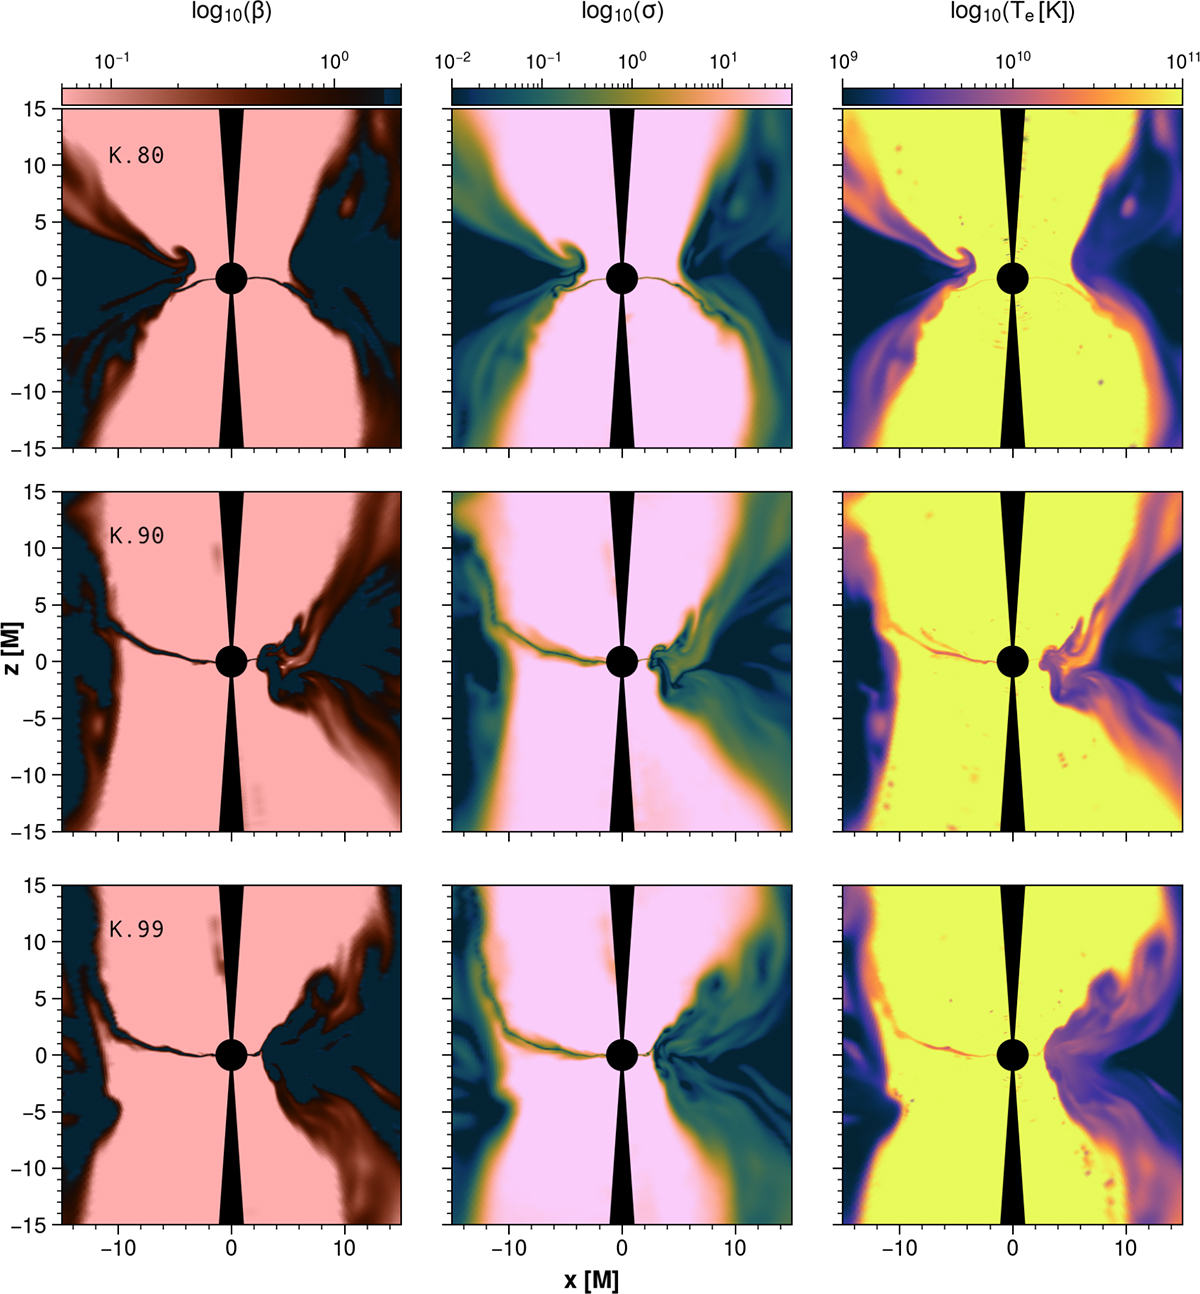
Meridional 2D slices of peak MAD state showing plasma β, σ, and Te of the simulations K.80, K.90, and K.99 (equal times to those in Fig. 8 for each simulation, respectively). We show the 180° azimuthally rotated cross-section of K.99, for comparison of the MAD states.
Current usage metrics show cumulative count of Article Views (full-text article views including HTML views, PDF and ePub downloads, according to the available data) and Abstracts Views on Vision4Press platform.
Data correspond to usage on the plateform after 2015. The current usage metrics is available 48-96 hours after online publication and is updated daily on week days.
Initial download of the metrics may take a while.