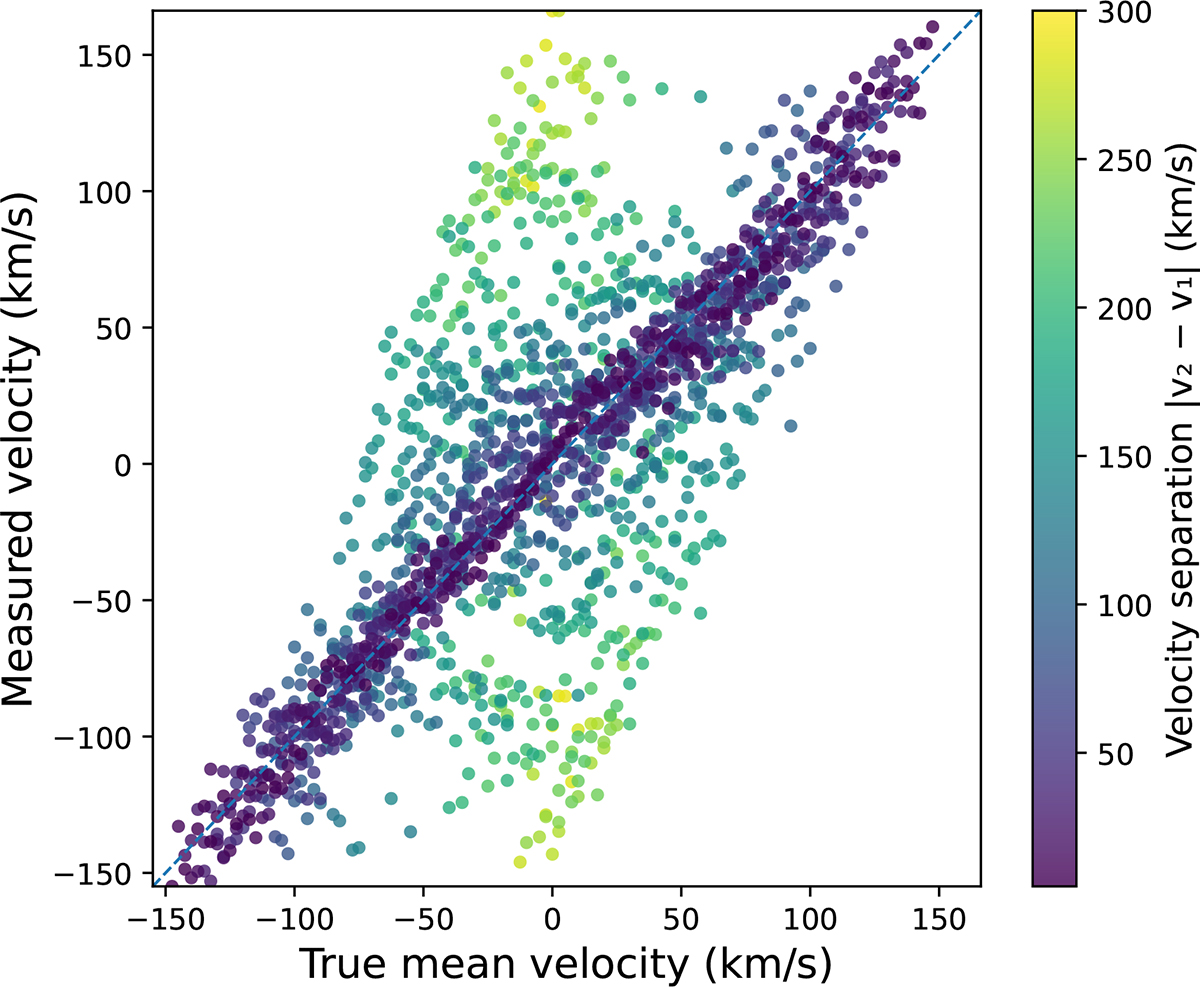
Fig. C.1.
Download original image
Measured versus true mean velocity for co-added two-epoch mock spectra at S/N = 5. Each point represents one realisation. The colour indicates the absolute separation |v2 − v1|. The dashed line marks the 1:1 relation. The strong clustering around the 1:1 line shows that full-spectrum fitting of co-added data recovers the period-averaged velocity of the input epochs. Outliers occur only for very large separations, where the stacked line becomes strongly double peaked.
Current usage metrics show cumulative count of Article Views (full-text article views including HTML views, PDF and ePub downloads, according to the available data) and Abstracts Views on Vision4Press platform.
Data correspond to usage on the plateform after 2015. The current usage metrics is available 48-96 hours after online publication and is updated daily on week days.
Initial download of the metrics may take a while.