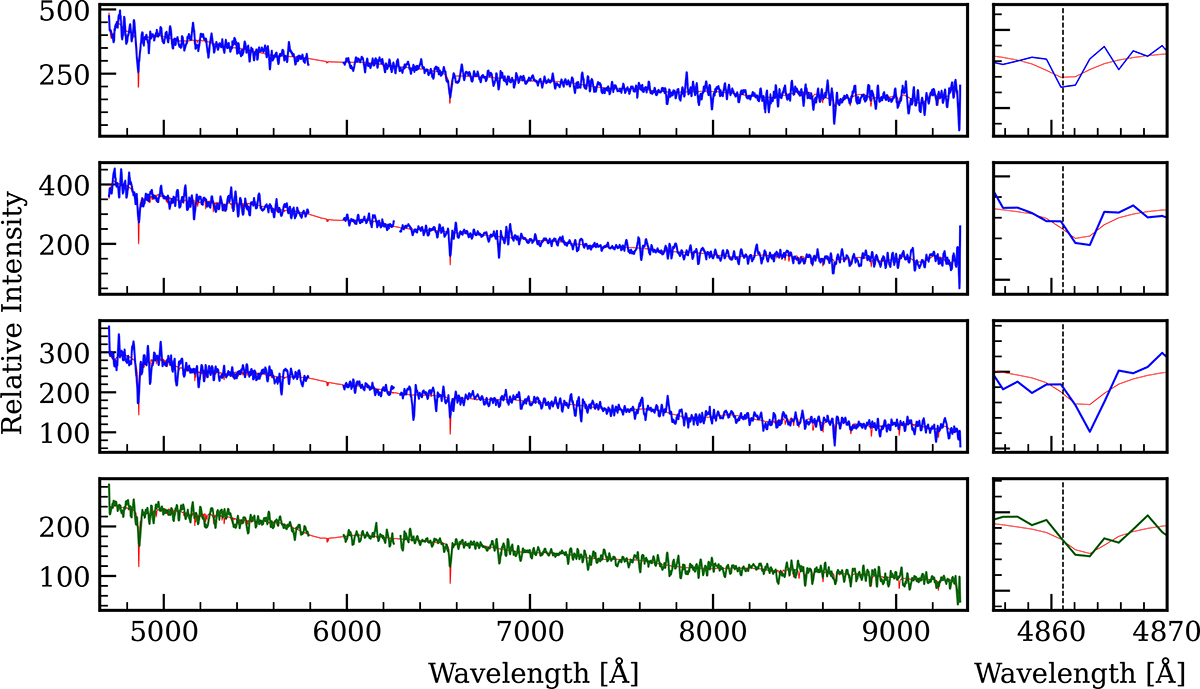
Fig. 2.
Download original image
Examples of spectra along with their corresponding spexxy best fit utilising three different epochs for a star likely to be in a binary system. The lower panel displays the combined spectrum from all five epochs, plotted in green. Given that this star is one of the most probable binaries in our sample, we provide a zoomed-in view of the Hβ line, with a dotted black line indicating the expected line centre in the rest frame to illustrate the shift in velocity from epoch to epoch. This shift between epochs affects the co-added spectrum, where the line is strongly diminished as a result of multiple velocity components blending together.
Current usage metrics show cumulative count of Article Views (full-text article views including HTML views, PDF and ePub downloads, according to the available data) and Abstracts Views on Vision4Press platform.
Data correspond to usage on the plateform after 2015. The current usage metrics is available 48-96 hours after online publication and is updated daily on week days.
Initial download of the metrics may take a while.