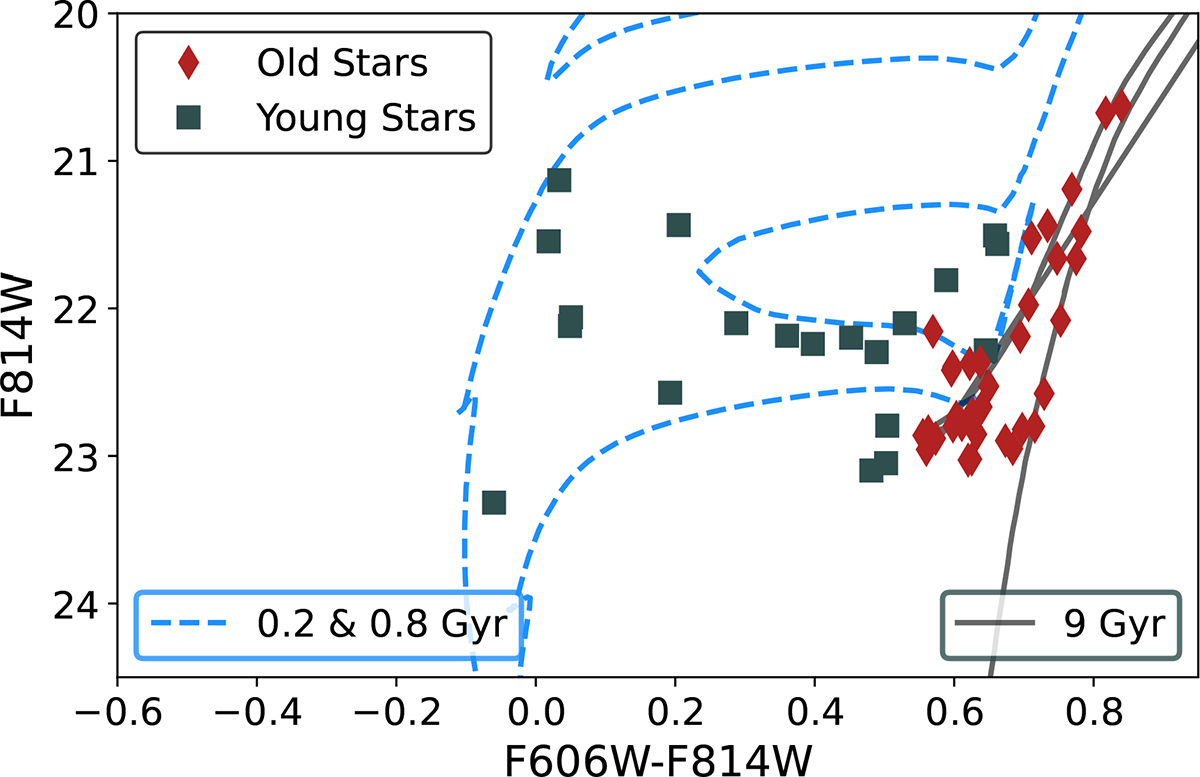
Fig. 3.
Download original image
Colour-magnitude diagram of the 55 stars plotted against PARSEC isochrones drawn for constant [Fe/H]= − 1.6 and variable age. The magnitudes given are on the Vega Magnitude System. The region spanned by 0.1 − 1 Gyr isochrones is represented by two isochrones shown for 0.2 and 0.8 Gyr. We also show a 9 Gyr isochrone for illustration of the old region spanned by > 5 Gyr. The stars that were found to be consistent with the younger isochrones are shown as dark blue squares while the stars consistent with the older isochrones are shown as red diamonds.
Current usage metrics show cumulative count of Article Views (full-text article views including HTML views, PDF and ePub downloads, according to the available data) and Abstracts Views on Vision4Press platform.
Data correspond to usage on the plateform after 2015. The current usage metrics is available 48-96 hours after online publication and is updated daily on week days.
Initial download of the metrics may take a while.