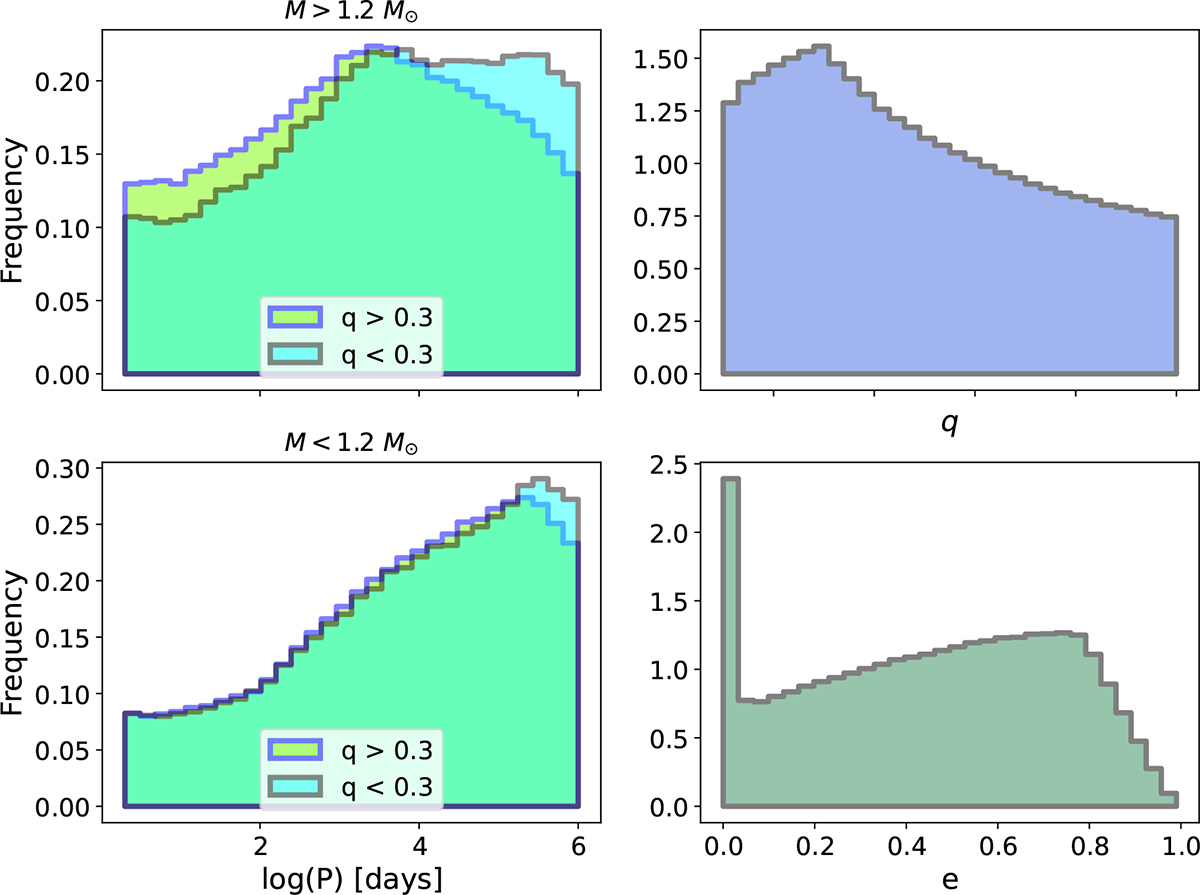
Fig. 4.
Download original image
Distributions of intrinsic parameters depicted in joint distributions showcasing various regimes for the period P on the left. We show the distribution alterations with respect to the mass ratio q and the primary mass M. The upper-left plot illustrates the distribution for M > 1.2 M⊙, while the lower left pertains to M < 1.2 M⊙, each highlighting regimes for q > 0.3 and q < 0.3. The top-right plot presents the distribution for the mass ratio q, while the bottom right illustrates the eccentricity distribution, notably demonstrating an abundance of circular orbits.
Current usage metrics show cumulative count of Article Views (full-text article views including HTML views, PDF and ePub downloads, according to the available data) and Abstracts Views on Vision4Press platform.
Data correspond to usage on the plateform after 2015. The current usage metrics is available 48-96 hours after online publication and is updated daily on week days.
Initial download of the metrics may take a while.