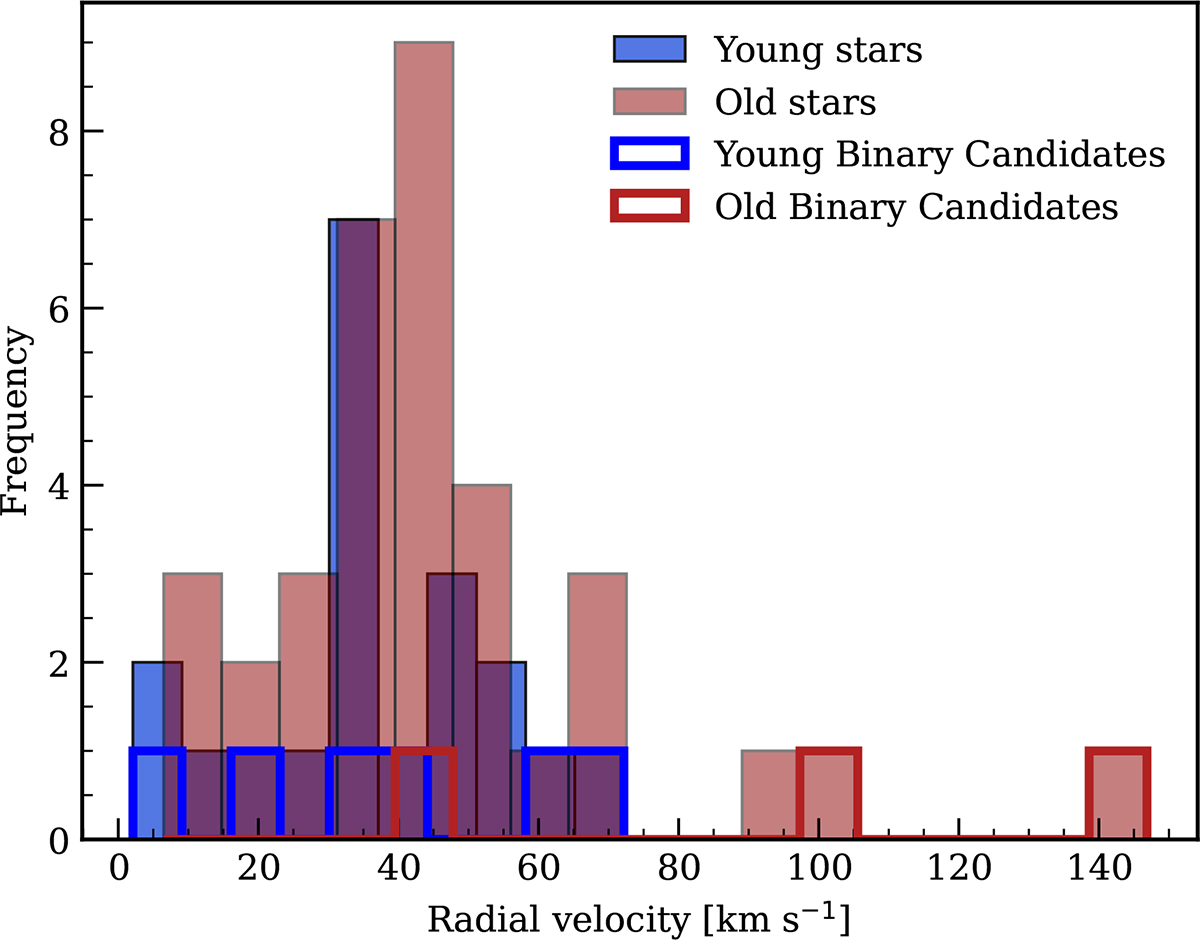
Fig. 6.
Download original image
Radial velocity distributions of the young (blue) and old (red) stellar populations in Leo T. Filled histograms show the full samples, with five bins for the young population and ten bins for the old population. Outliers identified by their high χ2 values (6 for the young stars and 3 for the old stars) are indicated by the step histograms with bold outlines. The mean velocities of the two populations differ by more than 1σ, consistent with the presence of two kinematically distinct groups.
Current usage metrics show cumulative count of Article Views (full-text article views including HTML views, PDF and ePub downloads, according to the available data) and Abstracts Views on Vision4Press platform.
Data correspond to usage on the plateform after 2015. The current usage metrics is available 48-96 hours after online publication and is updated daily on week days.
Initial download of the metrics may take a while.