Fig. 1
Download original image
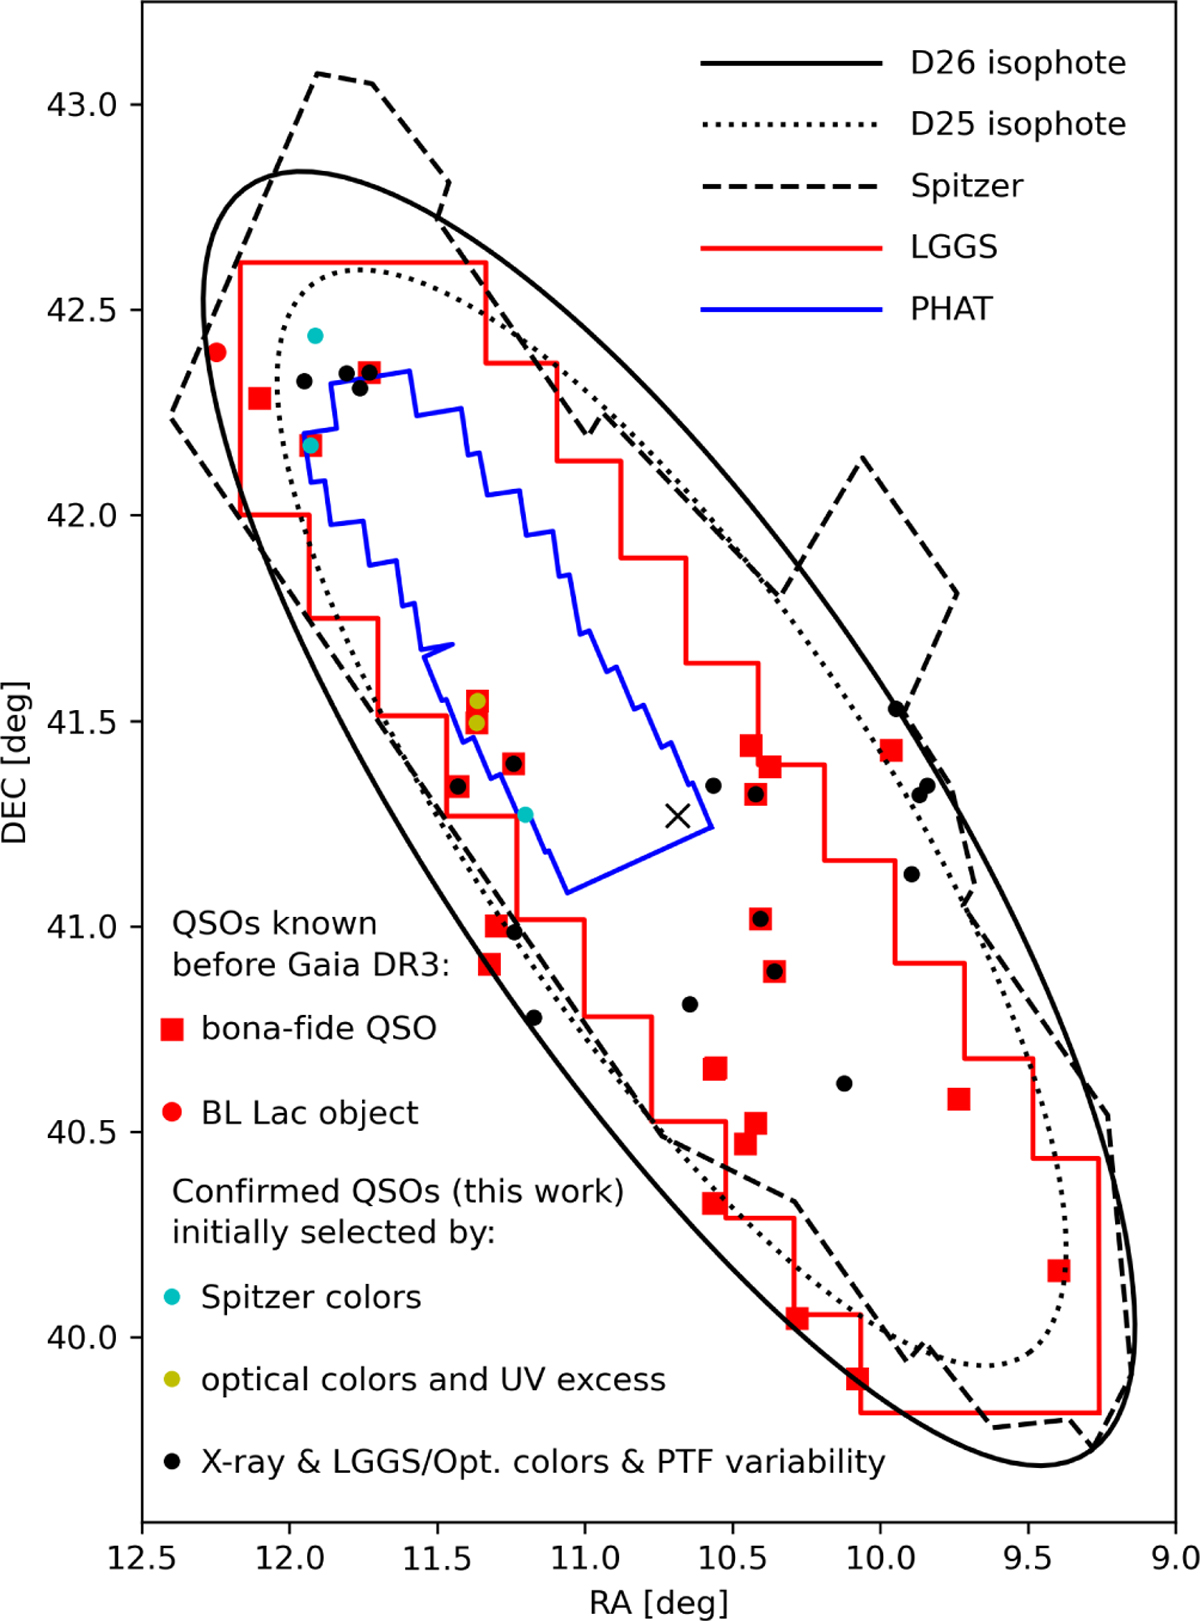
Map of the 24 bona fide QSOs (red squares) with prominent emission lines and 1 BL Lac object (red dot) known from the literature before Gaia DR3 (Gaia Collaboration 2023b). The confirmed QSOs from our target list are also shown: 3 Spitzer-selected (cyan), 2 selected from optical colors and UV excess (yellow), and 18 selected by other means (see Table A.1; black). All objects are located within the µB = 26m/□″ isophote (black solid line). The µB=25m/□″ isophote (dotted line), the approximate boundaries of the Spitzer PSC catalog (dashed line) and the footprints of LGGS (red) and PHAT (blue) catalogs are also plotted.
Current usage metrics show cumulative count of Article Views (full-text article views including HTML views, PDF and ePub downloads, according to the available data) and Abstracts Views on Vision4Press platform.
Data correspond to usage on the plateform after 2015. The current usage metrics is available 48-96 hours after online publication and is updated daily on week days.
Initial download of the metrics may take a while.