Open Access
Fig. 3
Download original image
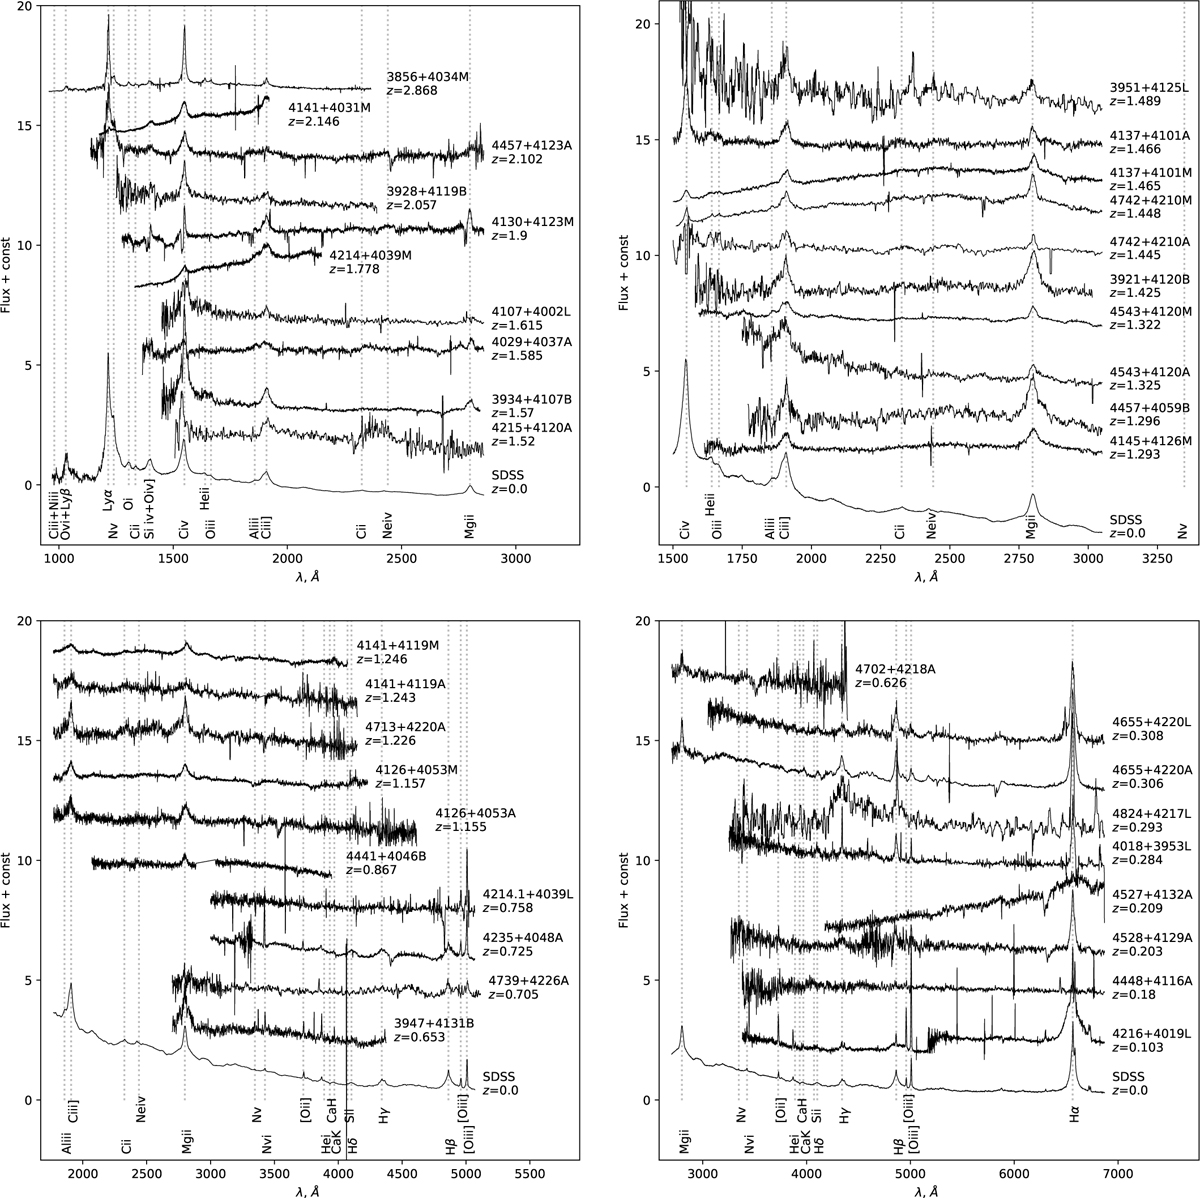
Spectra of the observed objects sorted by redshift, shown at rest-frame wavelength. Some more prominent features are marked with vertical dashed lines and are labeled. The SDSS composite quasar spectrum (Vanden Berk et al. 2001) is also plotted at the bottom of each panel.
Current usage metrics show cumulative count of Article Views (full-text article views including HTML views, PDF and ePub downloads, according to the available data) and Abstracts Views on Vision4Press platform.
Data correspond to usage on the plateform after 2015. The current usage metrics is available 48-96 hours after online publication and is updated daily on week days.
Initial download of the metrics may take a while.