Fig. 4
Download original image
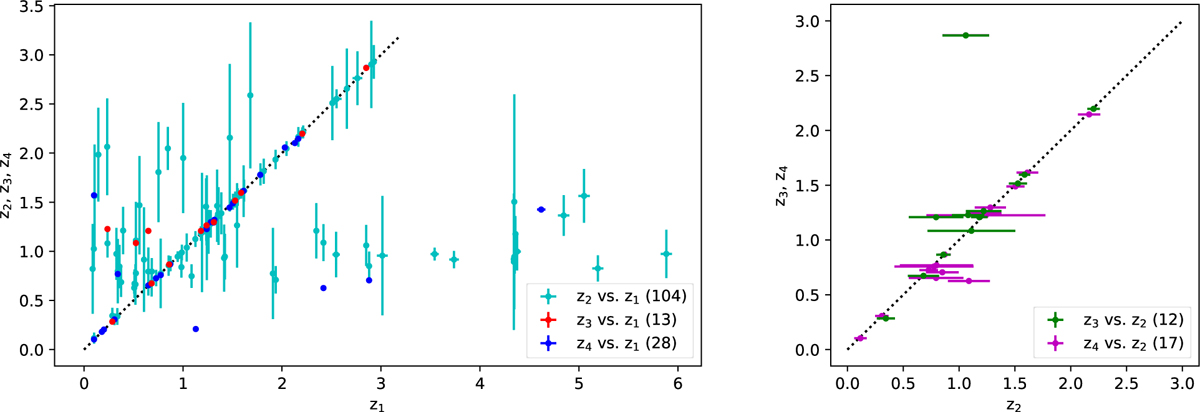
Cross-comparison of redshifts from different sources: z1 – Gaia Collaboration (2023a); z2 – Storey-Fisher et al. (2024); z3 – Dey et al. (2023); z4 – all other sources (listed in Table B.1), including this work redshift preference when available. Left: z2, z3, and z4 vs. z1. Right: z3 and z4 vs. z2. The published measurement errors are shown, except for Dey et al. (2023) who do not list them; in this case for plotting purposes we adopted errors equal to 0.005 dex. The bracketed numbers in the legends show how many objects constitute the overlapping subset between each pair of samples. The black dotted line has a slope of one.
Current usage metrics show cumulative count of Article Views (full-text article views including HTML views, PDF and ePub downloads, according to the available data) and Abstracts Views on Vision4Press platform.
Data correspond to usage on the plateform after 2015. The current usage metrics is available 48-96 hours after online publication and is updated daily on week days.
Initial download of the metrics may take a while.