Fig. E.1
Download original image
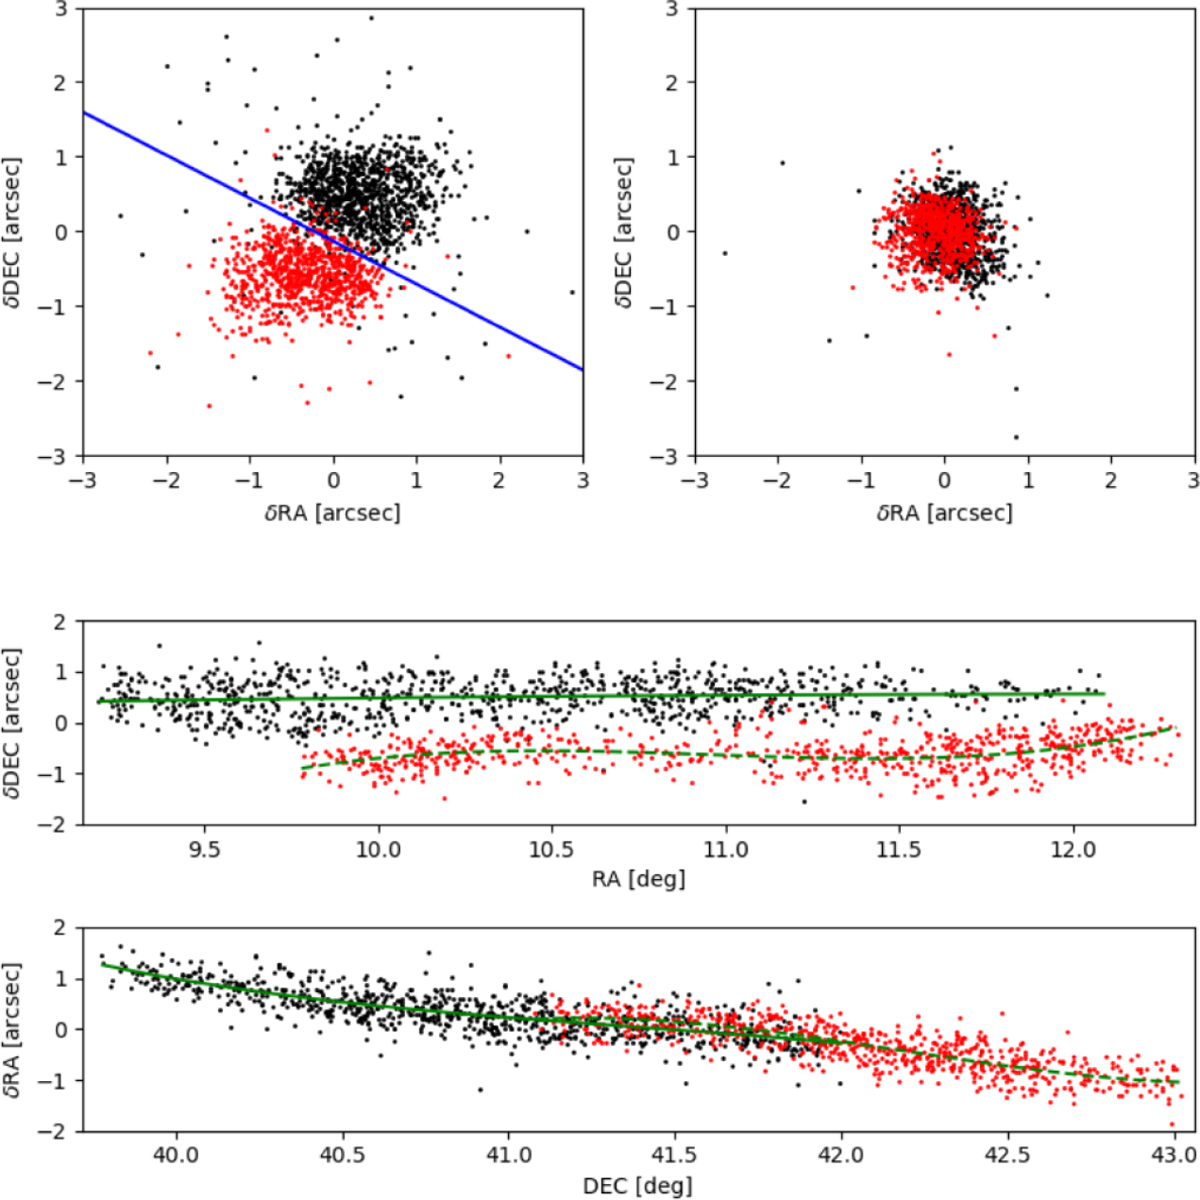
Upper left: δRA/δDEC plot for the astrometric Spitzer–WISE comparison of 1623 objects from our bright astrometric sample. The double central clump is due to small systematic deviations in the Khan (2017) coordinate system. The blue line makes initial division of the astrometric sample into two spatially distinct subsamples of ∼700 and ∼900 objects (see Fig. E.2). Upper right: Same plot after 3σ clipping and correcting for the systematic effect to the WISE coordinate system. Middle: δDEC(Spitzer–WISE) vs. WISE RA. Bottom: δRA(Spitzer–WISE) vs. WISE DEC. The solid and dashed green curves are the best fits to the trends for the two subsamples in the middle and bottom panels (see text).
Current usage metrics show cumulative count of Article Views (full-text article views including HTML views, PDF and ePub downloads, according to the available data) and Abstracts Views on Vision4Press platform.
Data correspond to usage on the plateform after 2015. The current usage metrics is available 48-96 hours after online publication and is updated daily on week days.
Initial download of the metrics may take a while.