Fig. E.2
Download original image
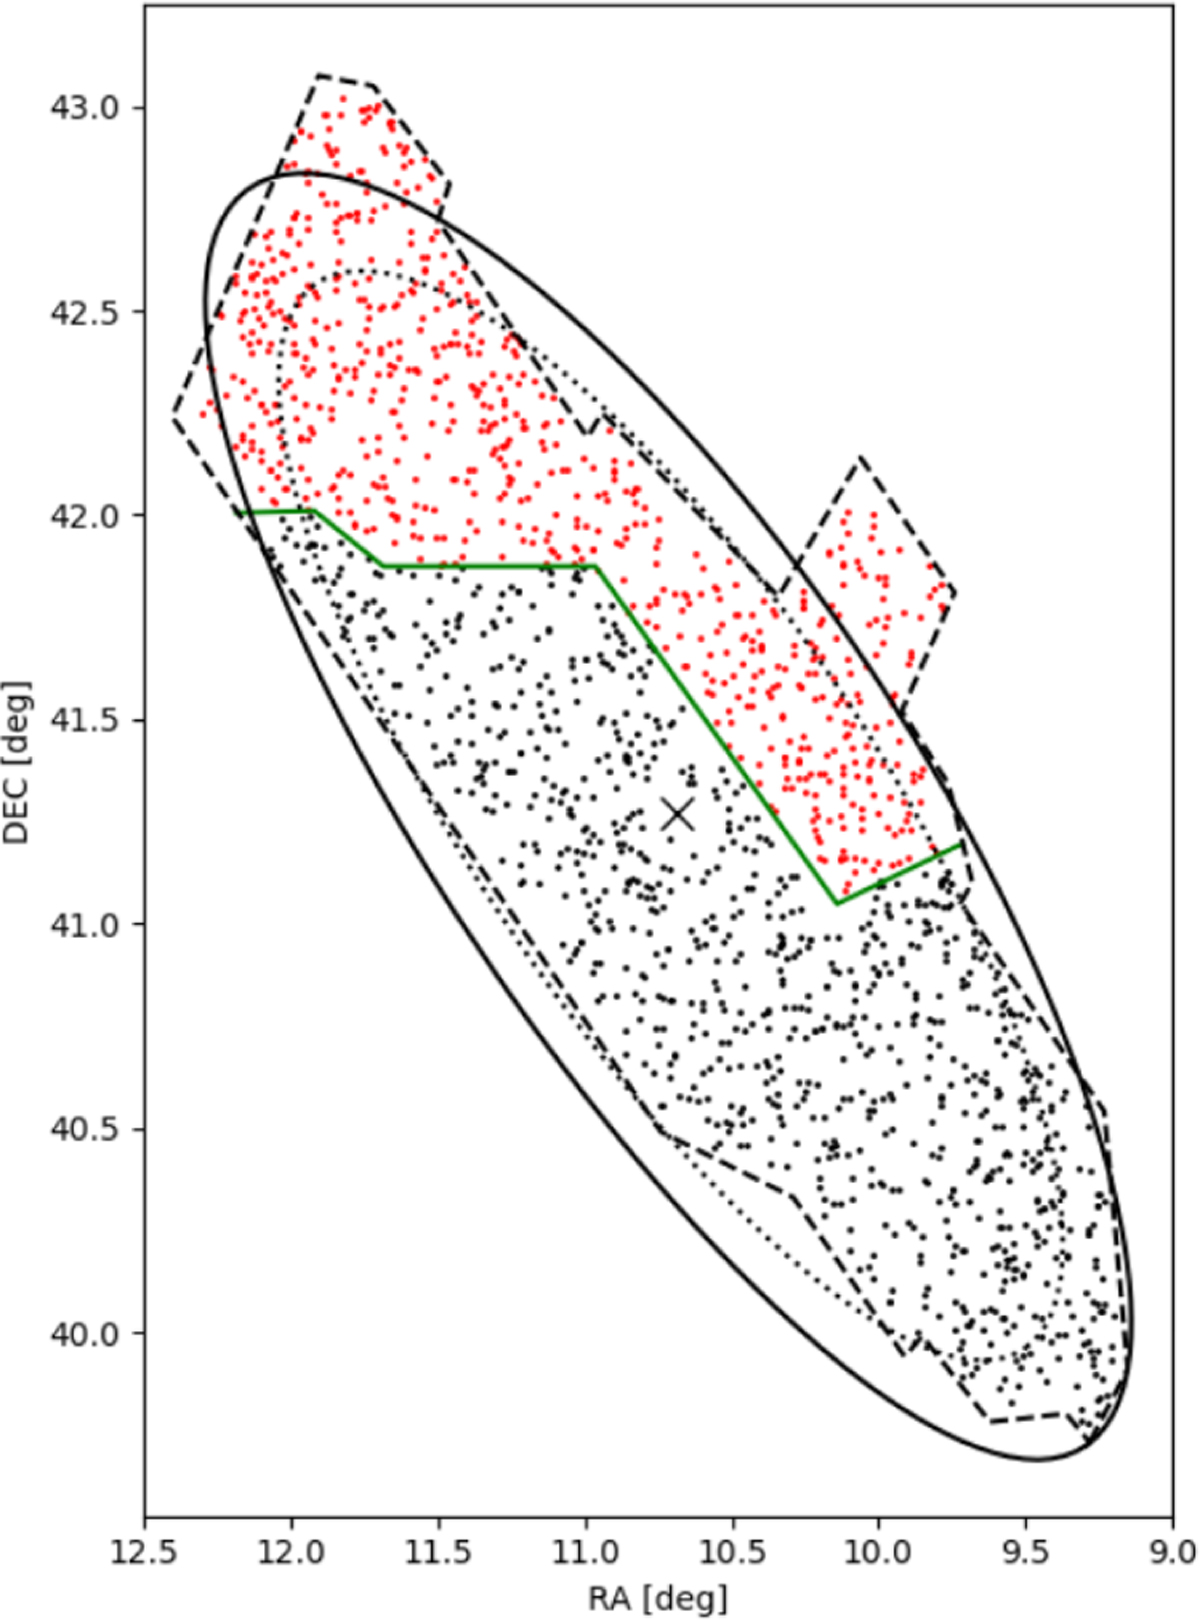
Map of our astrometric sample of 1623 objects with the adopted final dividing solid line (solid green) for the two spatially distinct samples of 710 (red dots) and 913 (black dots) objects. The dashed line shows the approximate outline of the Khan (2017) catalog; the solid and dotted lines show the µB = 26m/□″ and µB=25m/□″ isophotes, respectively. M 31 center is marked with an x.
Current usage metrics show cumulative count of Article Views (full-text article views including HTML views, PDF and ePub downloads, according to the available data) and Abstracts Views on Vision4Press platform.
Data correspond to usage on the plateform after 2015. The current usage metrics is available 48-96 hours after online publication and is updated daily on week days.
Initial download of the metrics may take a while.