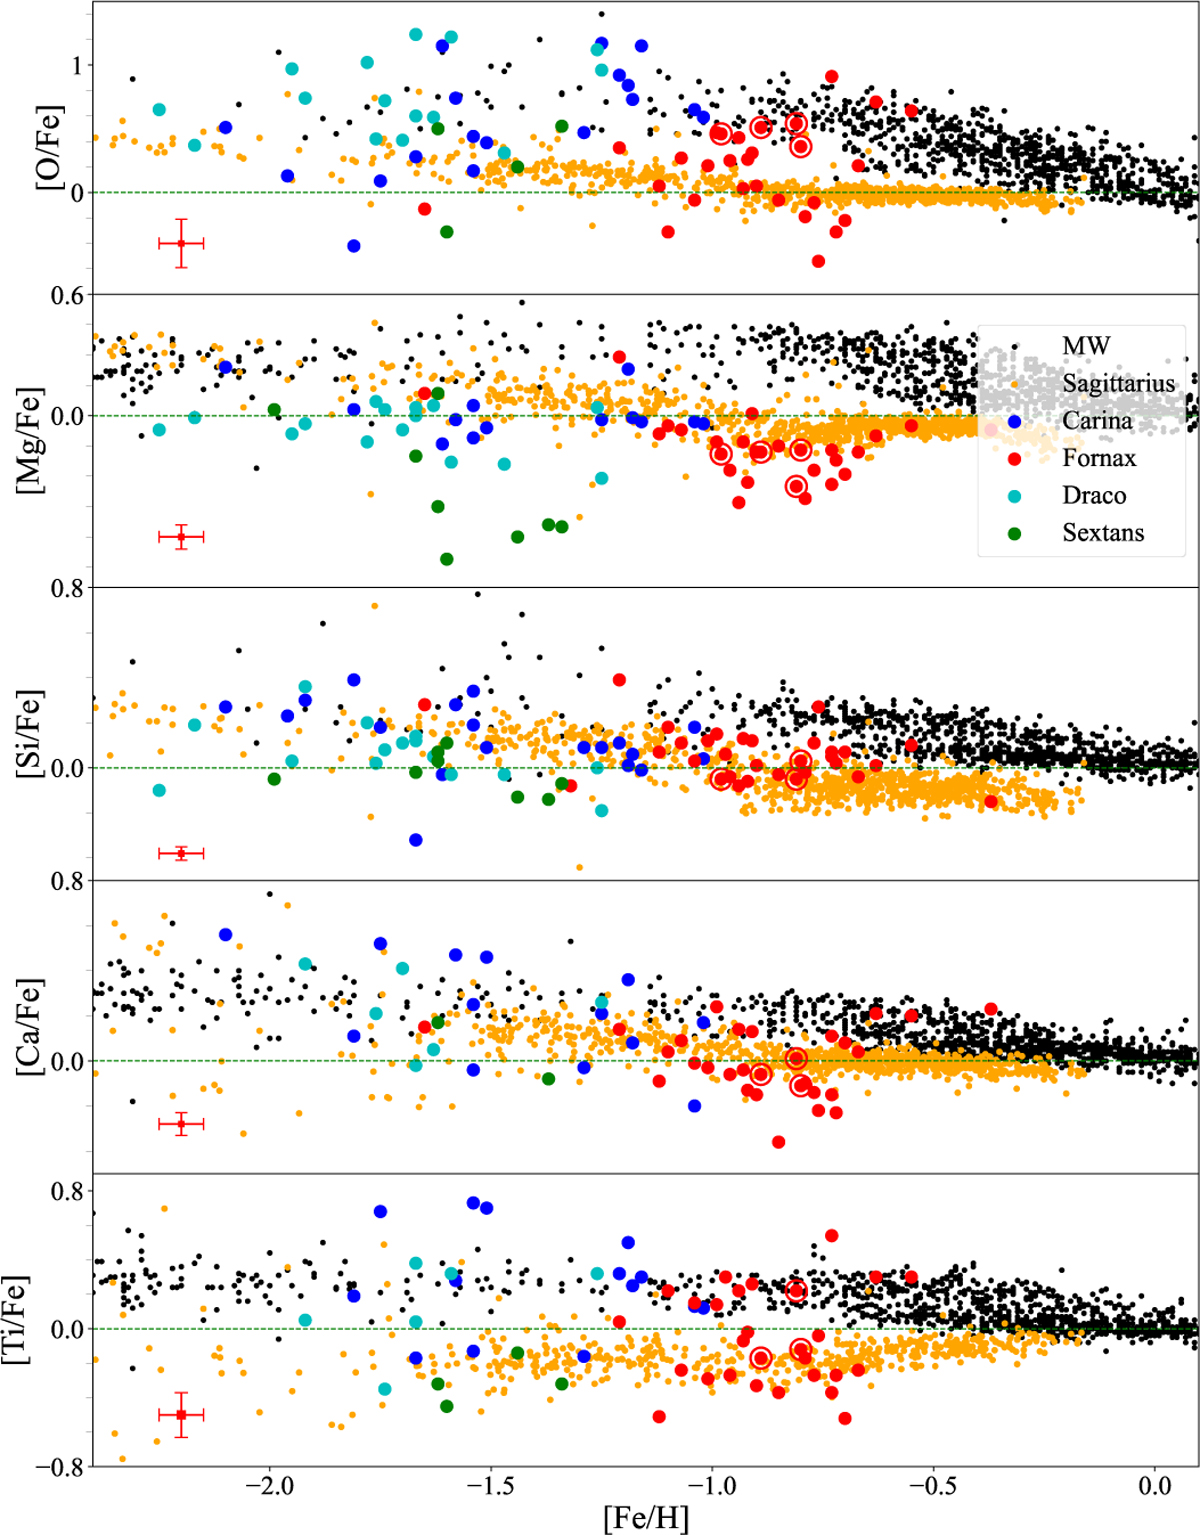
Fig. 2
Download original image
[α/Fe] vs. [Fe/H]. Fnx, Dra, Car and Sex stars from this work are labeled as red, cyan, blue and green stars respectively. The error bar in each panel indicates the typical error of available measurements. Black dots correspond to MW stars from the halo (Fulbright 2000; Cayrel et al. 2004; Barklem et al. 2005; Yong et al. 2013; Roederer et al. 2014), and MW stars from the disk (Reddy et al. 2003, 2006; Bensby et al. 2014). Orange dots represent Sgr stars from Hasselquist et al. (2021). Purple squares represent GCs in Fnx from Larsen et al. (2022).
Current usage metrics show cumulative count of Article Views (full-text article views including HTML views, PDF and ePub downloads, according to the available data) and Abstracts Views on Vision4Press platform.
Data correspond to usage on the plateform after 2015. The current usage metrics is available 48-96 hours after online publication and is updated daily on week days.
Initial download of the metrics may take a while.