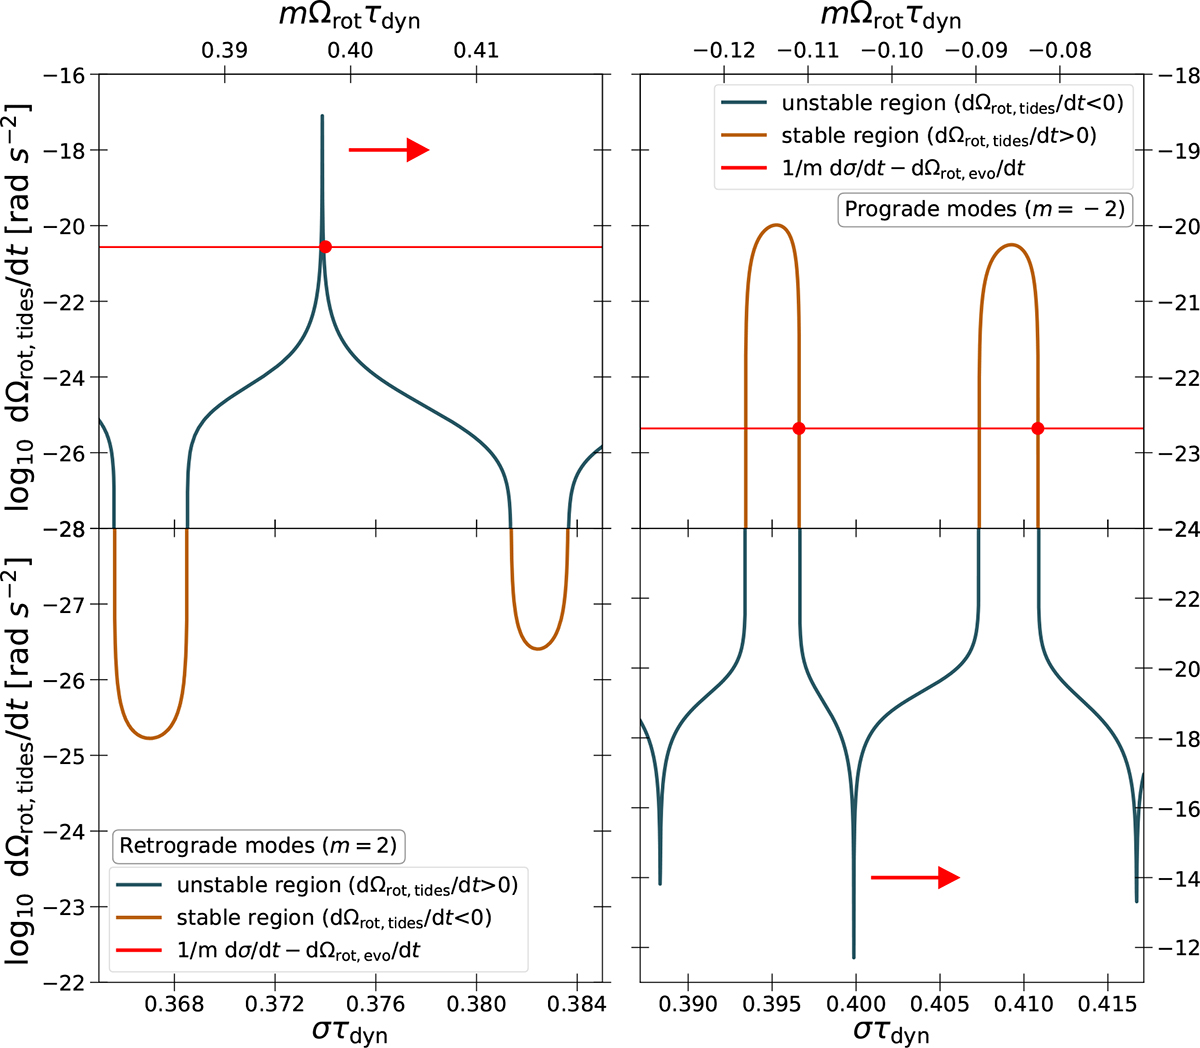
Fig. 1.
Download original image
Comparison of 1/m dσ/dt − (dΩrot/dt)evo (red curve) with (dΩrot/dt)tides for a retrograde mode (ℓ = 2, m = 2, k = −2, n = 30, Ωrot = 0.2 Ωcrit; left) and a prograde mode (ℓ = 2, m = −2, k = 2, n = 20, Ωrot = 0.05 Ωcrit; right). Forcing frequencies have been normalised by the dynamical timescale, τdyn. Blue segments represent unstable mode regions; orange curves represent stable regions. Arrows show the direction of mode evolution and spin trends. Red dots mark resonance locking points. Animated versions of this figure illustrating the various possible initial configurations and outcomes are provided in Appendix F.
Current usage metrics show cumulative count of Article Views (full-text article views including HTML views, PDF and ePub downloads, according to the available data) and Abstracts Views on Vision4Press platform.
Data correspond to usage on the plateform after 2015. The current usage metrics is available 48-96 hours after online publication and is updated daily on week days.
Initial download of the metrics may take a while.