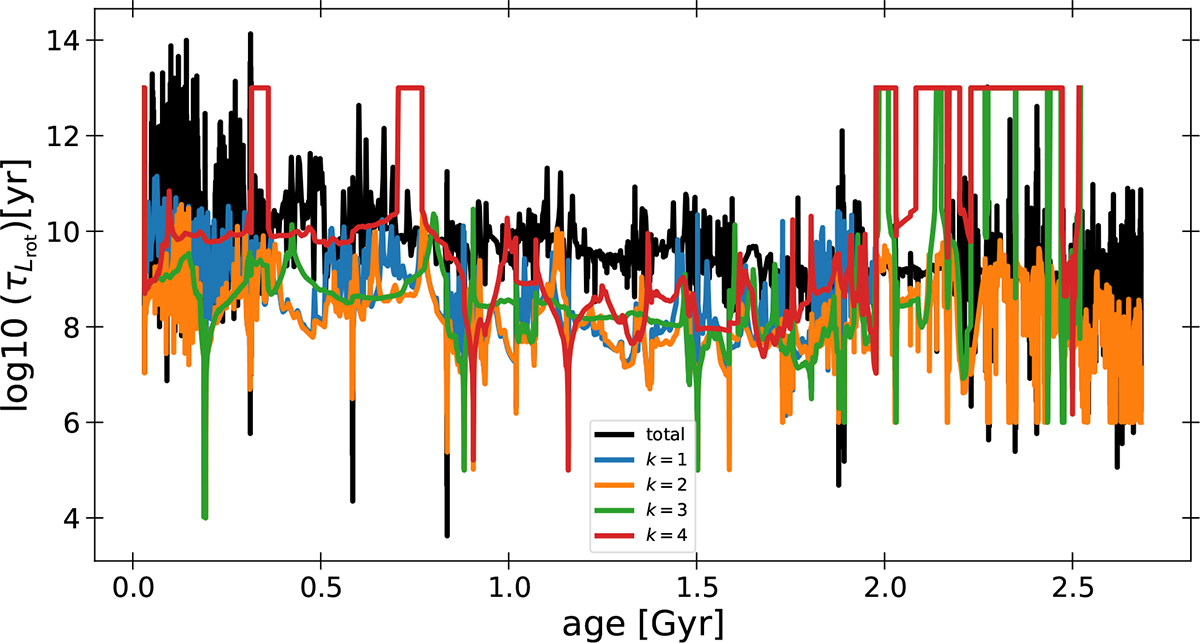
Fig. D.1.
Download original image
Timescale associated with the stellar rotational angular momentum as a function of system age for a twin system with high orbital frequency and low rotation frequency, as shown in Fig. 6. The plotted modes are prograde, with individual orbital harmonics k shown in different colors. The black line represents the total contribution from all modes.
Current usage metrics show cumulative count of Article Views (full-text article views including HTML views, PDF and ePub downloads, according to the available data) and Abstracts Views on Vision4Press platform.
Data correspond to usage on the plateform after 2015. The current usage metrics is available 48-96 hours after online publication and is updated daily on week days.
Initial download of the metrics may take a while.