Fig. F.4.
Download original image
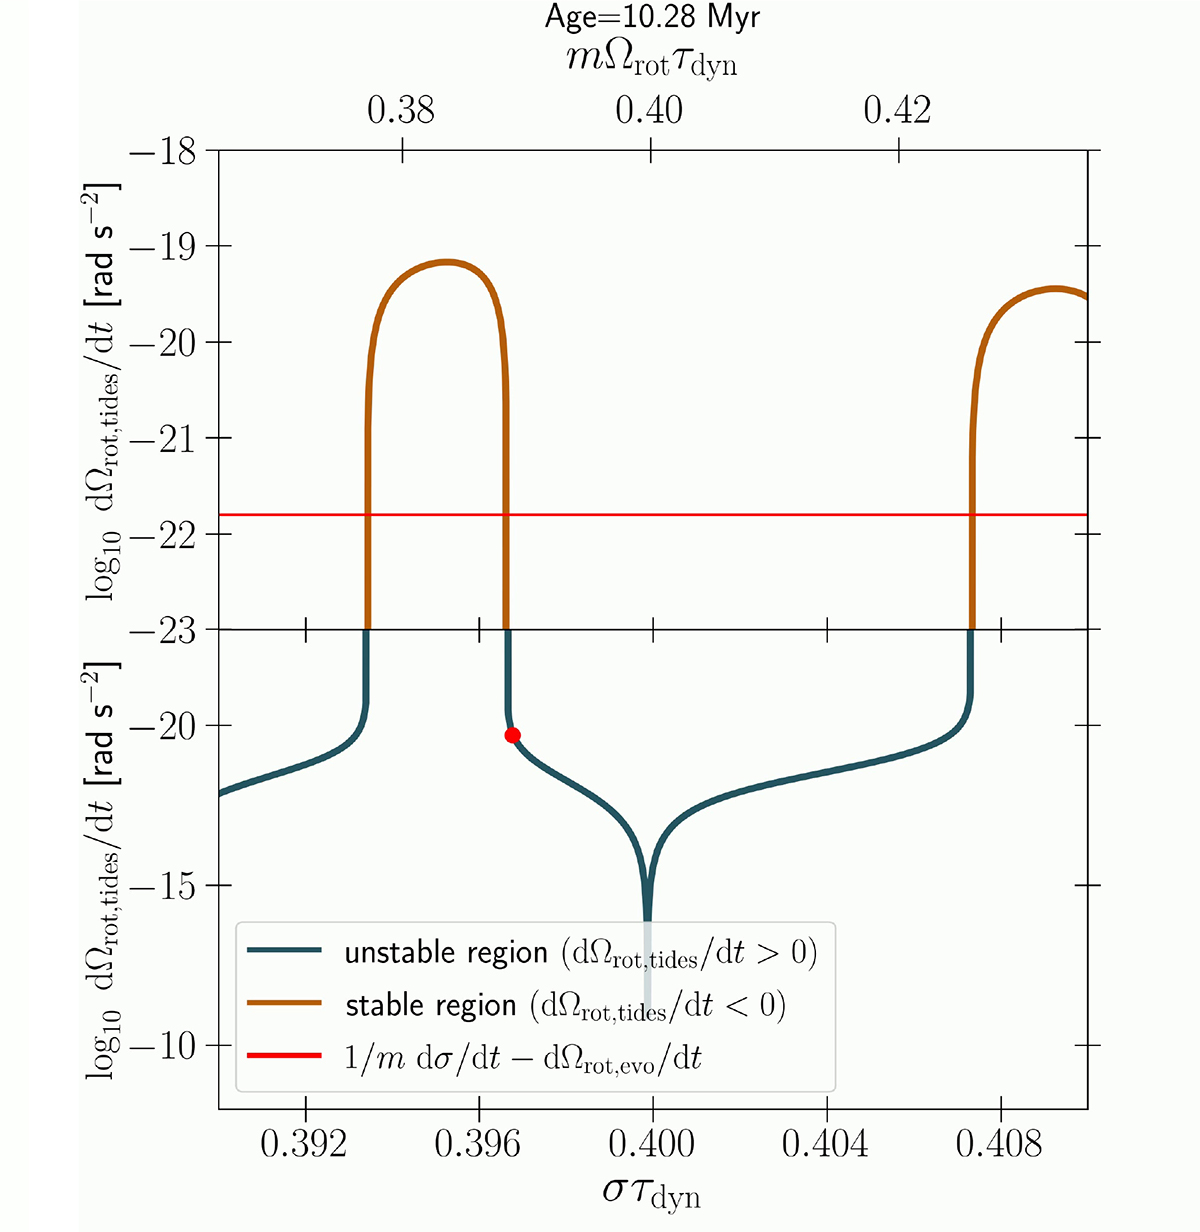
Movie available online showing the evolution of a system forcing frequency (red dot) including the effect of dynamical tidal on the stellar rotation ((dΩrot/dt)tides, given on the y-axis) for a prograde mode (ℓ = 2, m = −2, k = 2, n = 20, Ωrot = 0.05 Ωcrit). The red curve gives 1/m dσ/dt − (dΩrot/dt)evo, which corresponds to the possible locking positions. Blue segments represent unstable mode regions; orange curves represent stable regions. The animations starts on the right of the resonance locking position identified in Fig. 1.
Current usage metrics show cumulative count of Article Views (full-text article views including HTML views, PDF and ePub downloads, according to the available data) and Abstracts Views on Vision4Press platform.
Data correspond to usage on the plateform after 2015. The current usage metrics is available 48-96 hours after online publication and is updated daily on week days.
Initial download of the metrics may take a while.