Fig. A.1.
Download original image
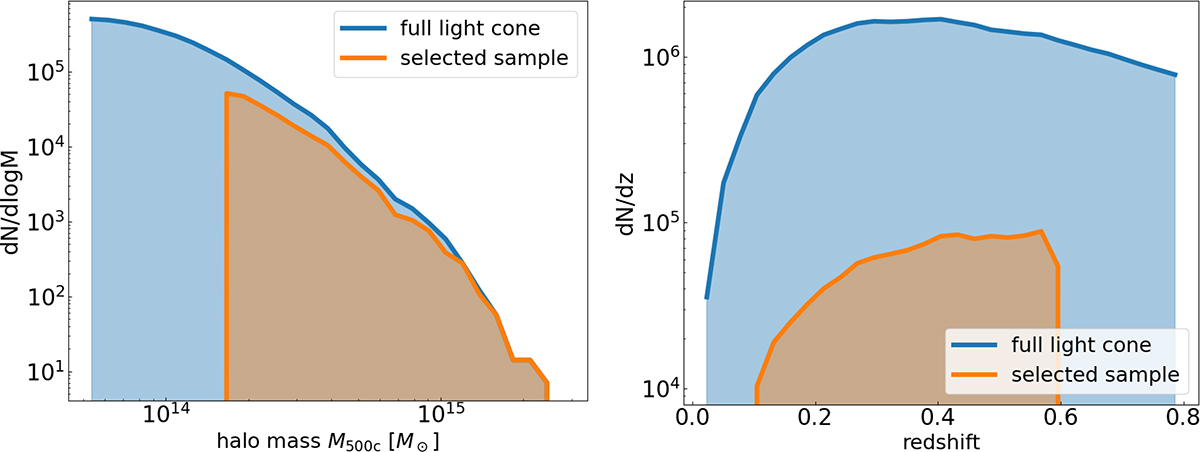
Comparison between the complete cluster population in the simulation from Seppi et al. (2022) and the selected one. The number of clusters per logarithmic unit of halo mass is shown in the left panel, and the number of clusters per unit of redshift in the right panel. The blue color refers to the full population, the orange to the one after the application of the ideal selection function.
Current usage metrics show cumulative count of Article Views (full-text article views including HTML views, PDF and ePub downloads, according to the available data) and Abstracts Views on Vision4Press platform.
Data correspond to usage on the plateform after 2015. The current usage metrics is available 48-96 hours after online publication and is updated daily on week days.
Initial download of the metrics may take a while.