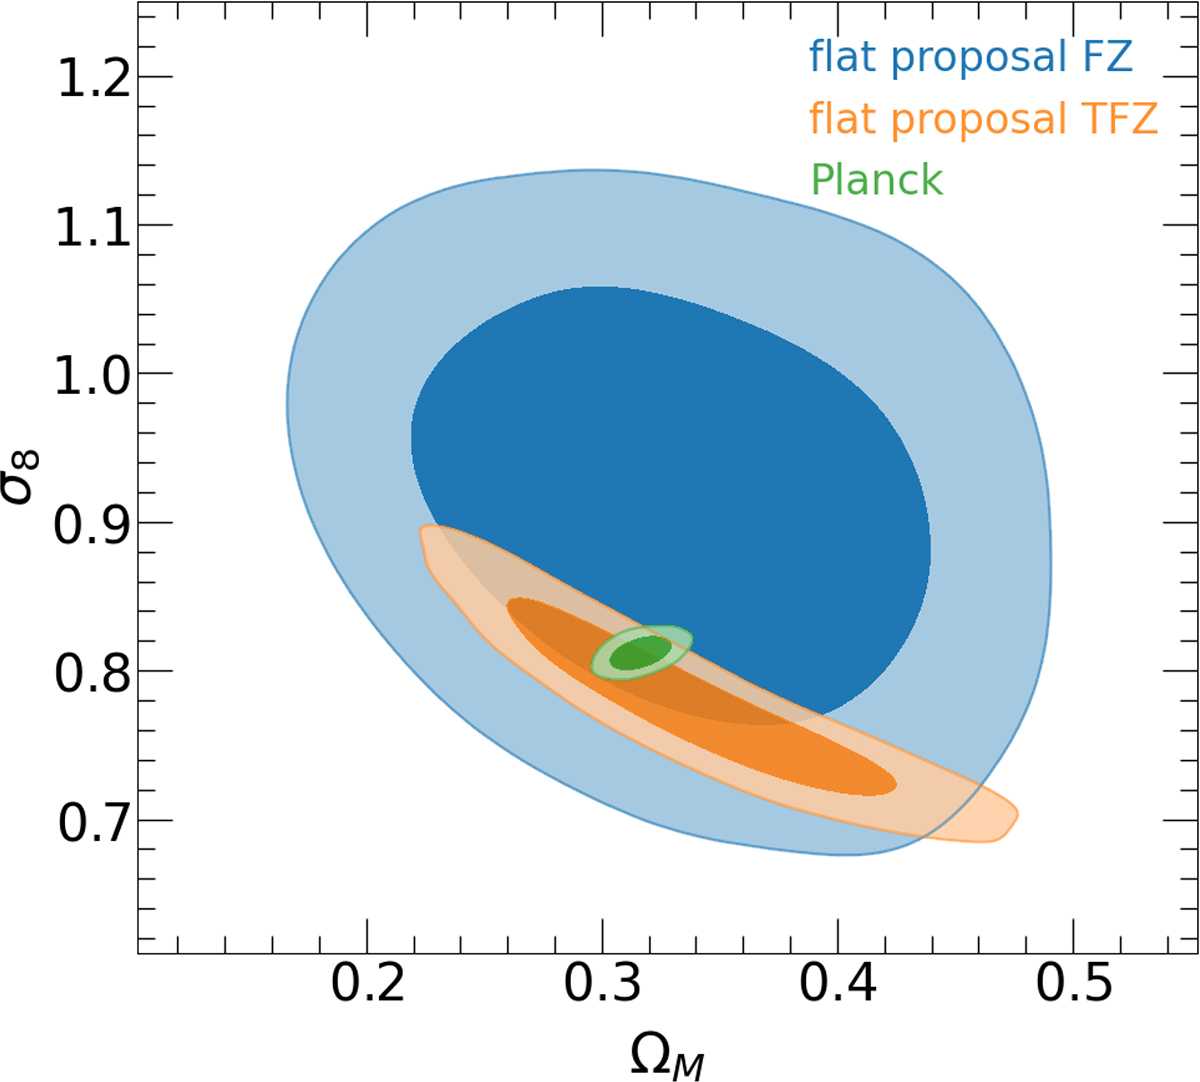
Fig. C.1.
Download original image
Crossed posterior distributions of Ωm and σ8 for a mock survey area of 50 deg2 with a uniform proposal. The distribution in blue considers only the flux and redshift distribution, while the one in orange also includes the temperature distribution. The results are compared to the Planck values used in UNIT1i in green. The contours represent the 1σ and 2σ confidence levels.
Current usage metrics show cumulative count of Article Views (full-text article views including HTML views, PDF and ePub downloads, according to the available data) and Abstracts Views on Vision4Press platform.
Data correspond to usage on the plateform after 2015. The current usage metrics is available 48-96 hours after online publication and is updated daily on week days.
Initial download of the metrics may take a while.