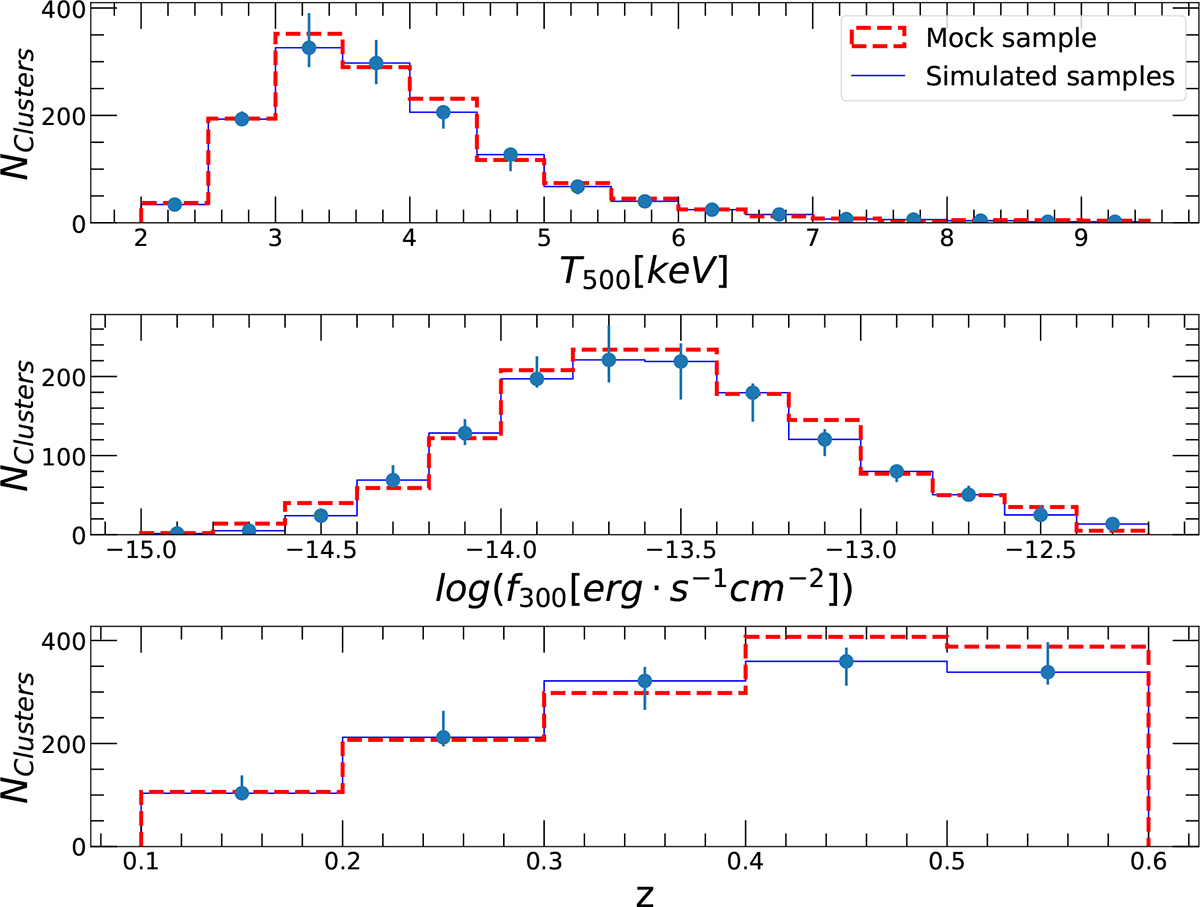
Fig. 3.
Download original image
Temperature, flux, and redshift histograms for 1000 deg2 with the UNIT1i mock observation in red and results computed from the obtained posterior parameters in blue. The blue points show the median value for each bin across a range of simulated samples generated from the posterior distributions using our method with flat priors for each parameter and a uniform proposal distribution for training the model. The error bars show the standard deviation of the simulated samples in each bin.
Current usage metrics show cumulative count of Article Views (full-text article views including HTML views, PDF and ePub downloads, according to the available data) and Abstracts Views on Vision4Press platform.
Data correspond to usage on the plateform after 2015. The current usage metrics is available 48-96 hours after online publication and is updated daily on week days.
Initial download of the metrics may take a while.