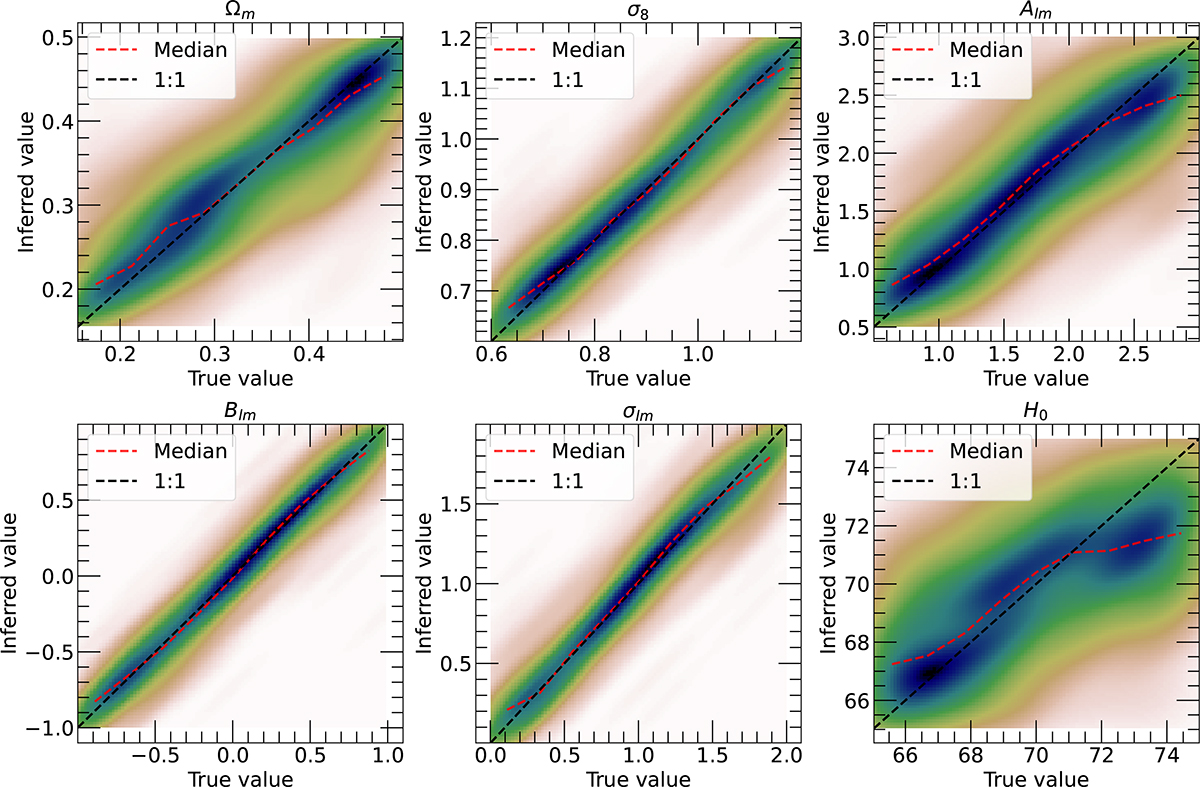
Fig. 6.
Download original image
Results of coverage test described in Sect. 4.4, comparing the input values (true values) to the inferred ones for each parameter by taking random points in the posterior distribution chains. The point density was smoothed using a Gaussian kernel-density estimator and indicated by the color code, with the median of the points indicated by a dashed red line, and the 1:1 line in black.
Current usage metrics show cumulative count of Article Views (full-text article views including HTML views, PDF and ePub downloads, according to the available data) and Abstracts Views on Vision4Press platform.
Data correspond to usage on the plateform after 2015. The current usage metrics is available 48-96 hours after online publication and is updated daily on week days.
Initial download of the metrics may take a while.