Open Access
Fig. 7.
Download original image
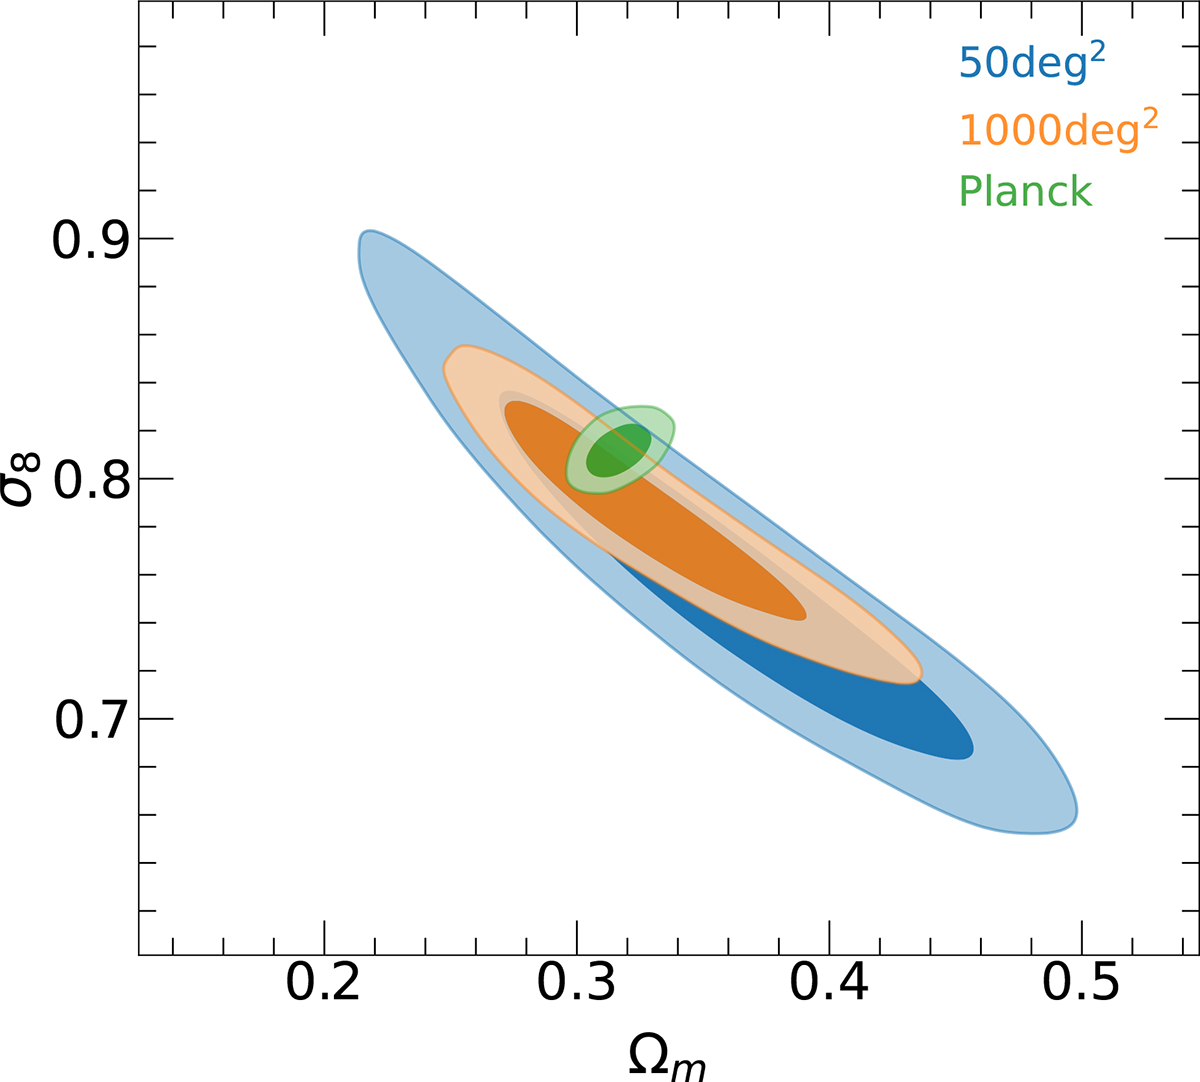
Posterior distributions in Ωm − σ8 plane for mock survey areas of 50 deg2 in blue and 1000 deg2 in orange, compared to the Planck values used in UNIT1i in green. The contours represent the 1σ and 2σ confidence levels.
Current usage metrics show cumulative count of Article Views (full-text article views including HTML views, PDF and ePub downloads, according to the available data) and Abstracts Views on Vision4Press platform.
Data correspond to usage on the plateform after 2015. The current usage metrics is available 48-96 hours after online publication and is updated daily on week days.
Initial download of the metrics may take a while.