Fig. 9.
Download original image
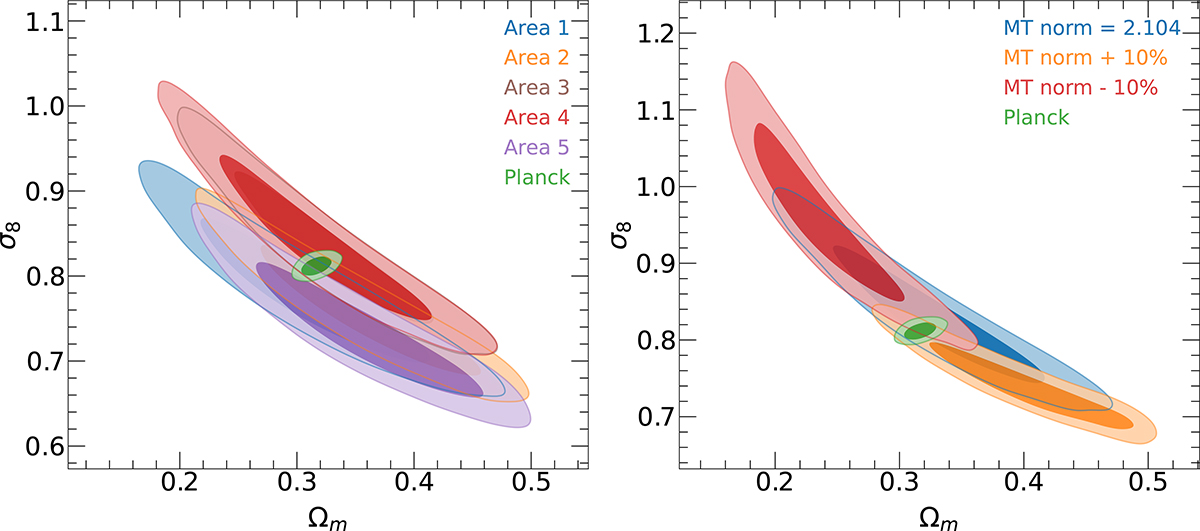
Left panel shows a sample variance test in the form of 2D posterior distributions of Ωm and σ8 for different 50 deg2 regions of the mock observation with a uniform proposal. The contours represent the 1σ and 2σ confidence levels. The right panel is the crossed posterior distributions of Ωm and σ8 for a mock survey covering an area of 50 deg2 with a uniform proposal. The distribution shown in blue assumes an M–T normalization parameter of 2.104 (see 3.4.1), while the distributions in orange and red correspond to variations of plus and minus 10% around this value, respectively. The results are compared with the Planck values used in UNIT1i (represented in green). The contours indicate the 1σ and 2σ confidence intervals.
Current usage metrics show cumulative count of Article Views (full-text article views including HTML views, PDF and ePub downloads, according to the available data) and Abstracts Views on Vision4Press platform.
Data correspond to usage on the plateform after 2015. The current usage metrics is available 48-96 hours after online publication and is updated daily on week days.
Initial download of the metrics may take a while.