Open Access
Fig. 2.
Download original image
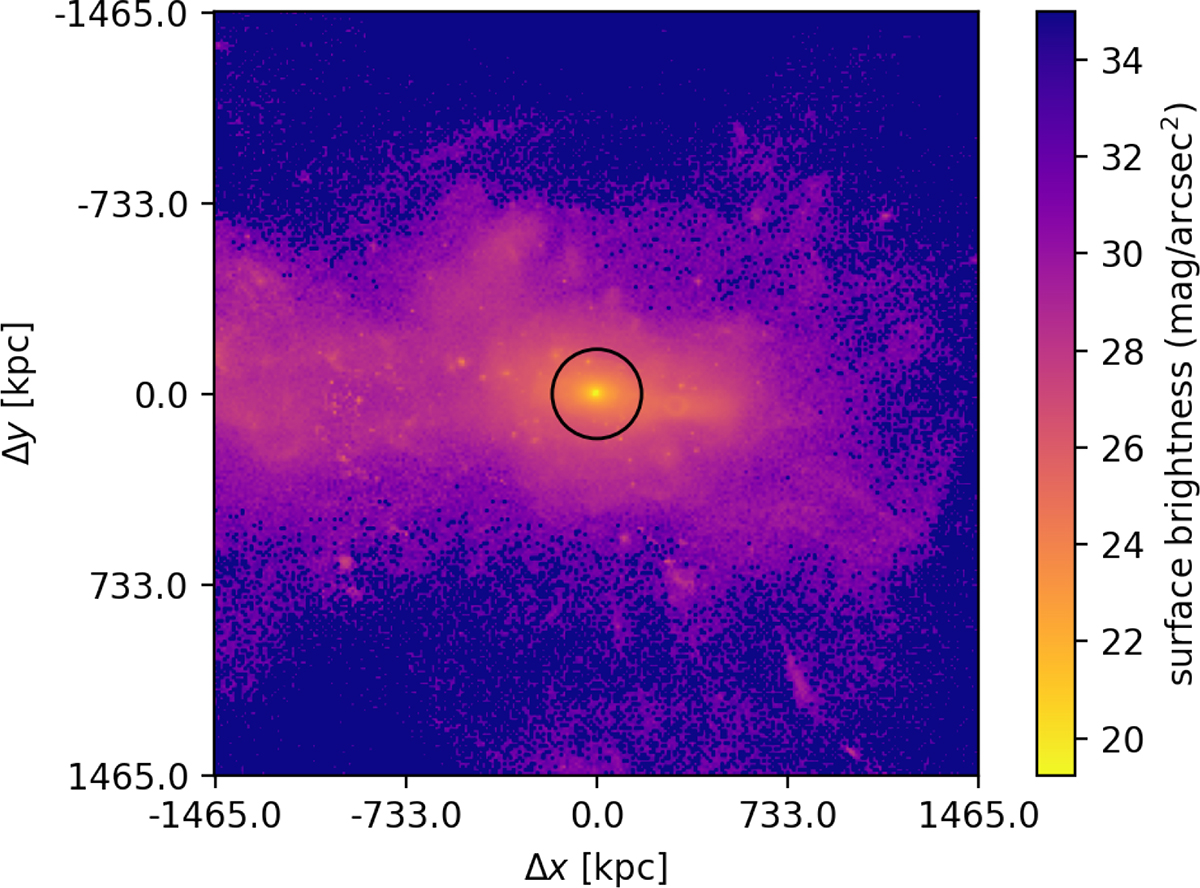
2D Surface brightness map of the BCG+ICL of a cluster in TNG100, centred on the BCG, with an upper limit of R200. The black circle shows the divide between the ICL and the BCG. Light from the centre extends for hundreds of kiloparsecs and substructure is visible in the ICL.
Current usage metrics show cumulative count of Article Views (full-text article views including HTML views, PDF and ePub downloads, according to the available data) and Abstracts Views on Vision4Press platform.
Data correspond to usage on the plateform after 2015. The current usage metrics is available 48-96 hours after online publication and is updated daily on week days.
Initial download of the metrics may take a while.