Open Access
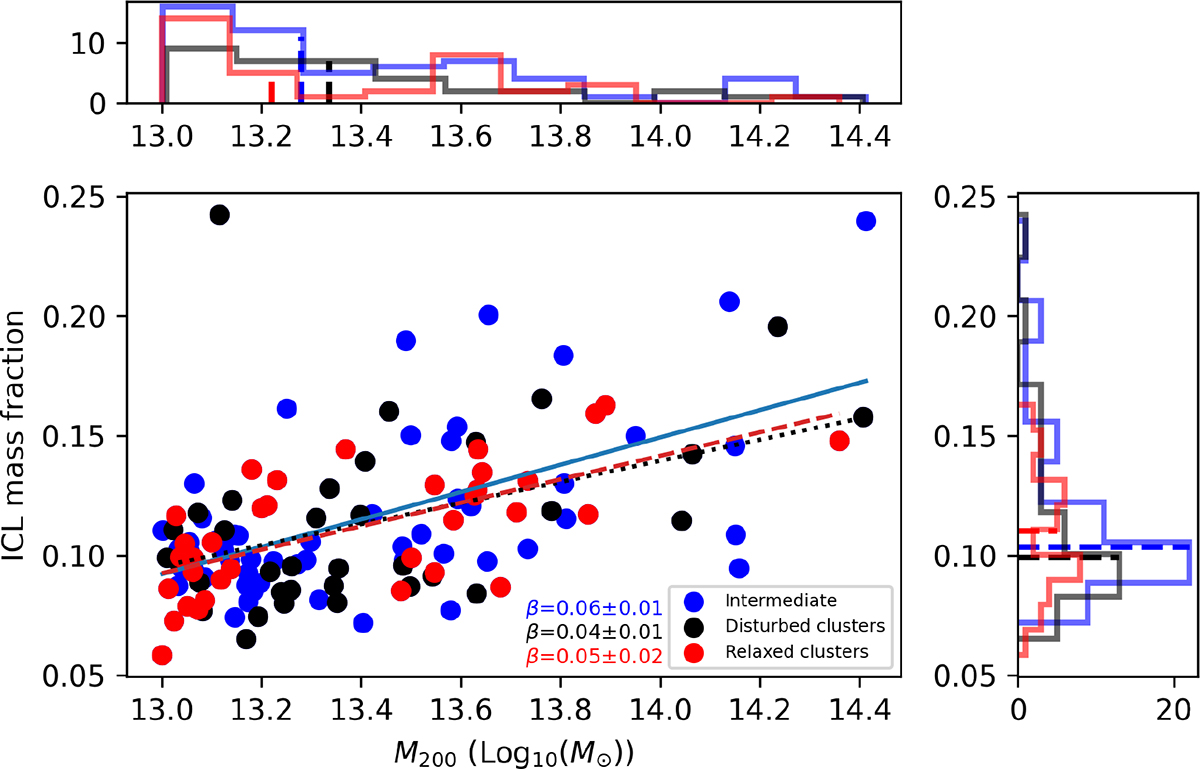
Fig. 3.
Download original image
Mass fraction of ICL in galaxy clusters, separated by cluster dynamical state, with histograms of cluster masses and state. The dashed lines on the histograms indicate the median. The slopes of the linear fit to the data, β, are indicated in the bottom centre of the panel.
Current usage metrics show cumulative count of Article Views (full-text article views including HTML views, PDF and ePub downloads, according to the available data) and Abstracts Views on Vision4Press platform.
Data correspond to usage on the plateform after 2015. The current usage metrics is available 48-96 hours after online publication and is updated daily on week days.
Initial download of the metrics may take a while.