Fig. 1.
Download original image
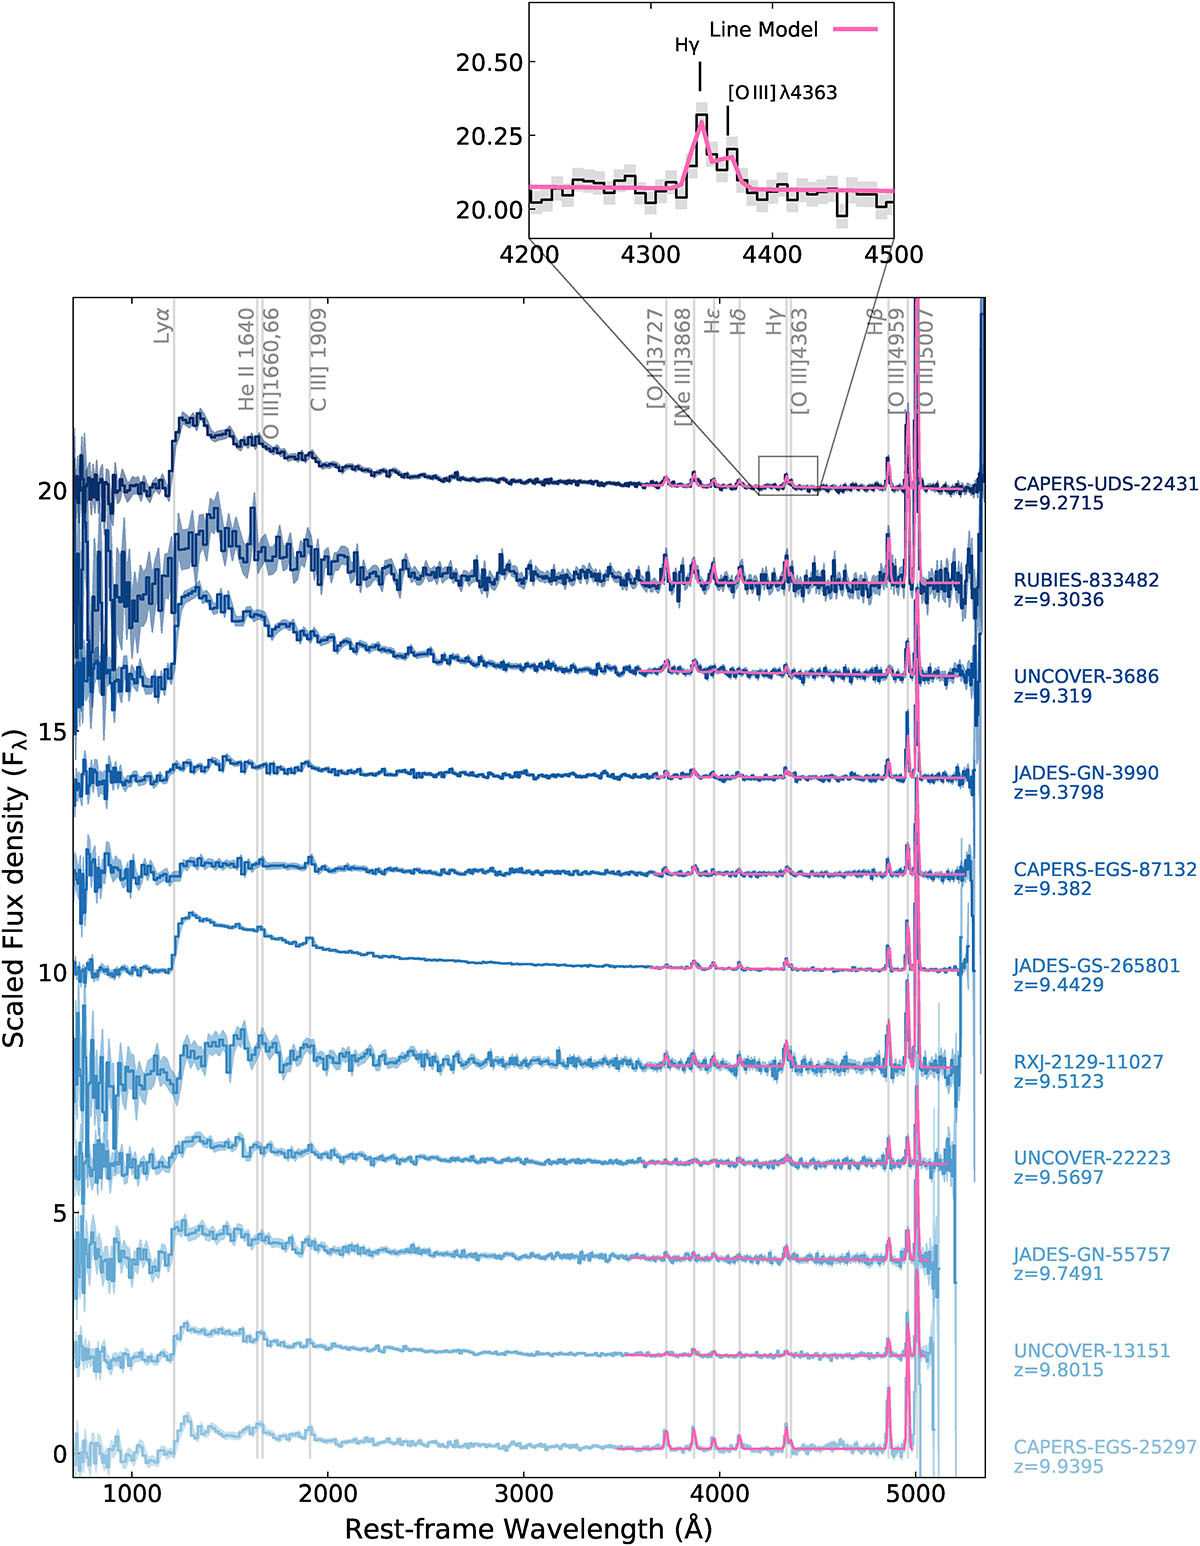
JWST/NIRSpec Prism 1D spectroscopy of the sample, shown in shades of blue, with the associated error spectrum as a shaded region. The positions of the main line transitions are highlighted by grey lines. The inset zooms in on the spectroscopically resolved Hγ + [O III] λ4363 emission lines, with the best-fit continuum and emission-line model for each galaxy shown by the pink lines.
Current usage metrics show cumulative count of Article Views (full-text article views including HTML views, PDF and ePub downloads, according to the available data) and Abstracts Views on Vision4Press platform.
Data correspond to usage on the plateform after 2015. The current usage metrics is available 48-96 hours after online publication and is updated daily on week days.
Initial download of the metrics may take a while.