Open Access
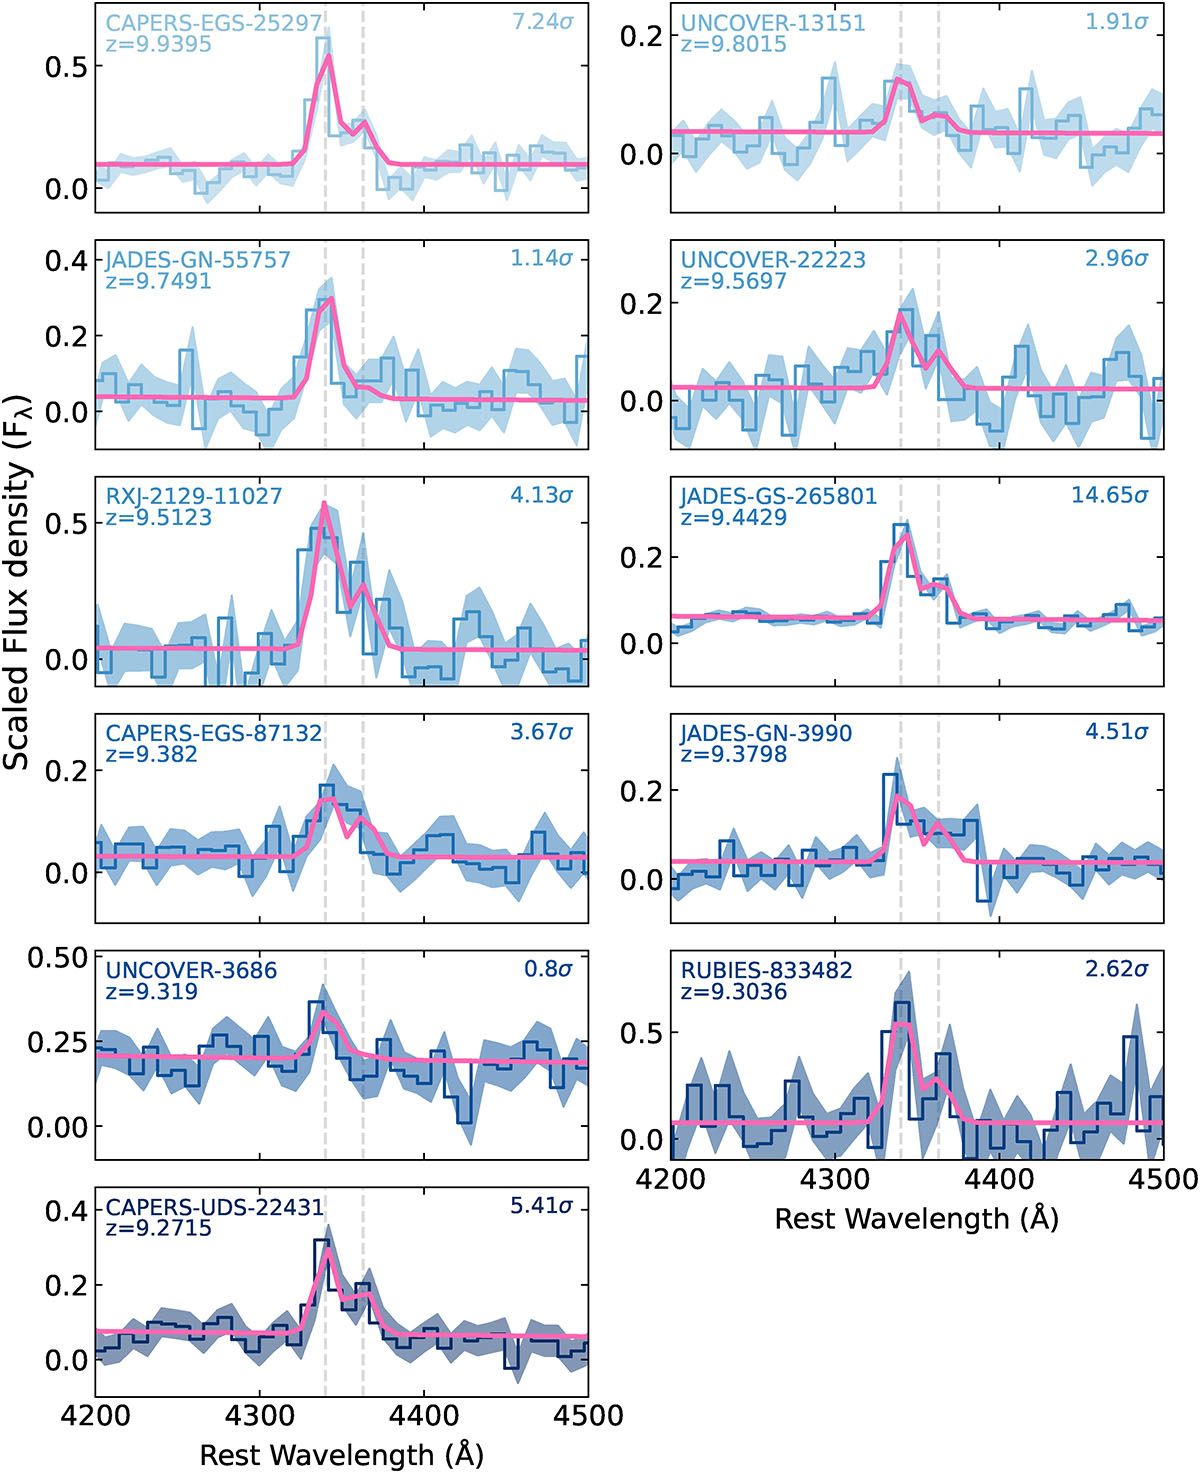
Fig. 2.
Download original image
Hγ and [O III] λ4363 regions for each galaxy are shown in shades of blue, along with the best fit emission line model in pink. The significance of the [O III] λ4363 line detection is shown in the top right corner of each subplot.
Current usage metrics show cumulative count of Article Views (full-text article views including HTML views, PDF and ePub downloads, according to the available data) and Abstracts Views on Vision4Press platform.
Data correspond to usage on the plateform after 2015. The current usage metrics is available 48-96 hours after online publication and is updated daily on week days.
Initial download of the metrics may take a while.