Fig. 3.
Download original image
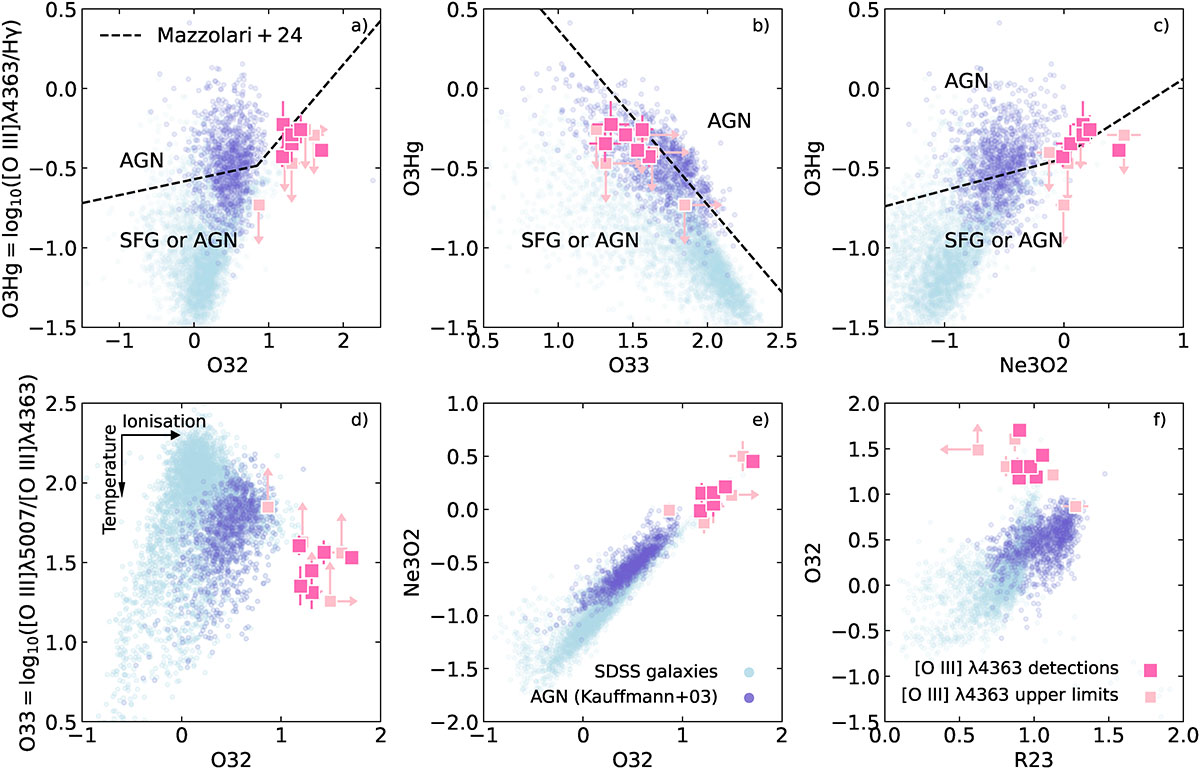
Line flux ratios of the z = 9 sample, with [O III] λ4363 detections in hot pink, and 3σ upper limits in pale pink. The light blue points show z ≈ 0 galaxies with [O III] λ4363 detections from from SDSS-DR15, for comparison. The dark blue points represent SDSS objects that lie in the AGN region of the [N II]/Hα Kauffmann et al. (2003) BPT diagram. Dashed lines represent AGN diagnostics utilising the [O III] auroral line from Mazzolari et al. (2024), calibrated using local and high-z samples of SFGs and AGNs.
Current usage metrics show cumulative count of Article Views (full-text article views including HTML views, PDF and ePub downloads, according to the available data) and Abstracts Views on Vision4Press platform.
Data correspond to usage on the plateform after 2015. The current usage metrics is available 48-96 hours after online publication and is updated daily on week days.
Initial download of the metrics may take a while.